
An overview of monitoring your workspaces
This feature is available for all users with the "Browse analytics" permission enabled. In the back office, go to Users & Groups > Users to check on your permissions.
Opendatasoft provides you with five different ways to monitor your workspaces, all found under Analytics in your back office.
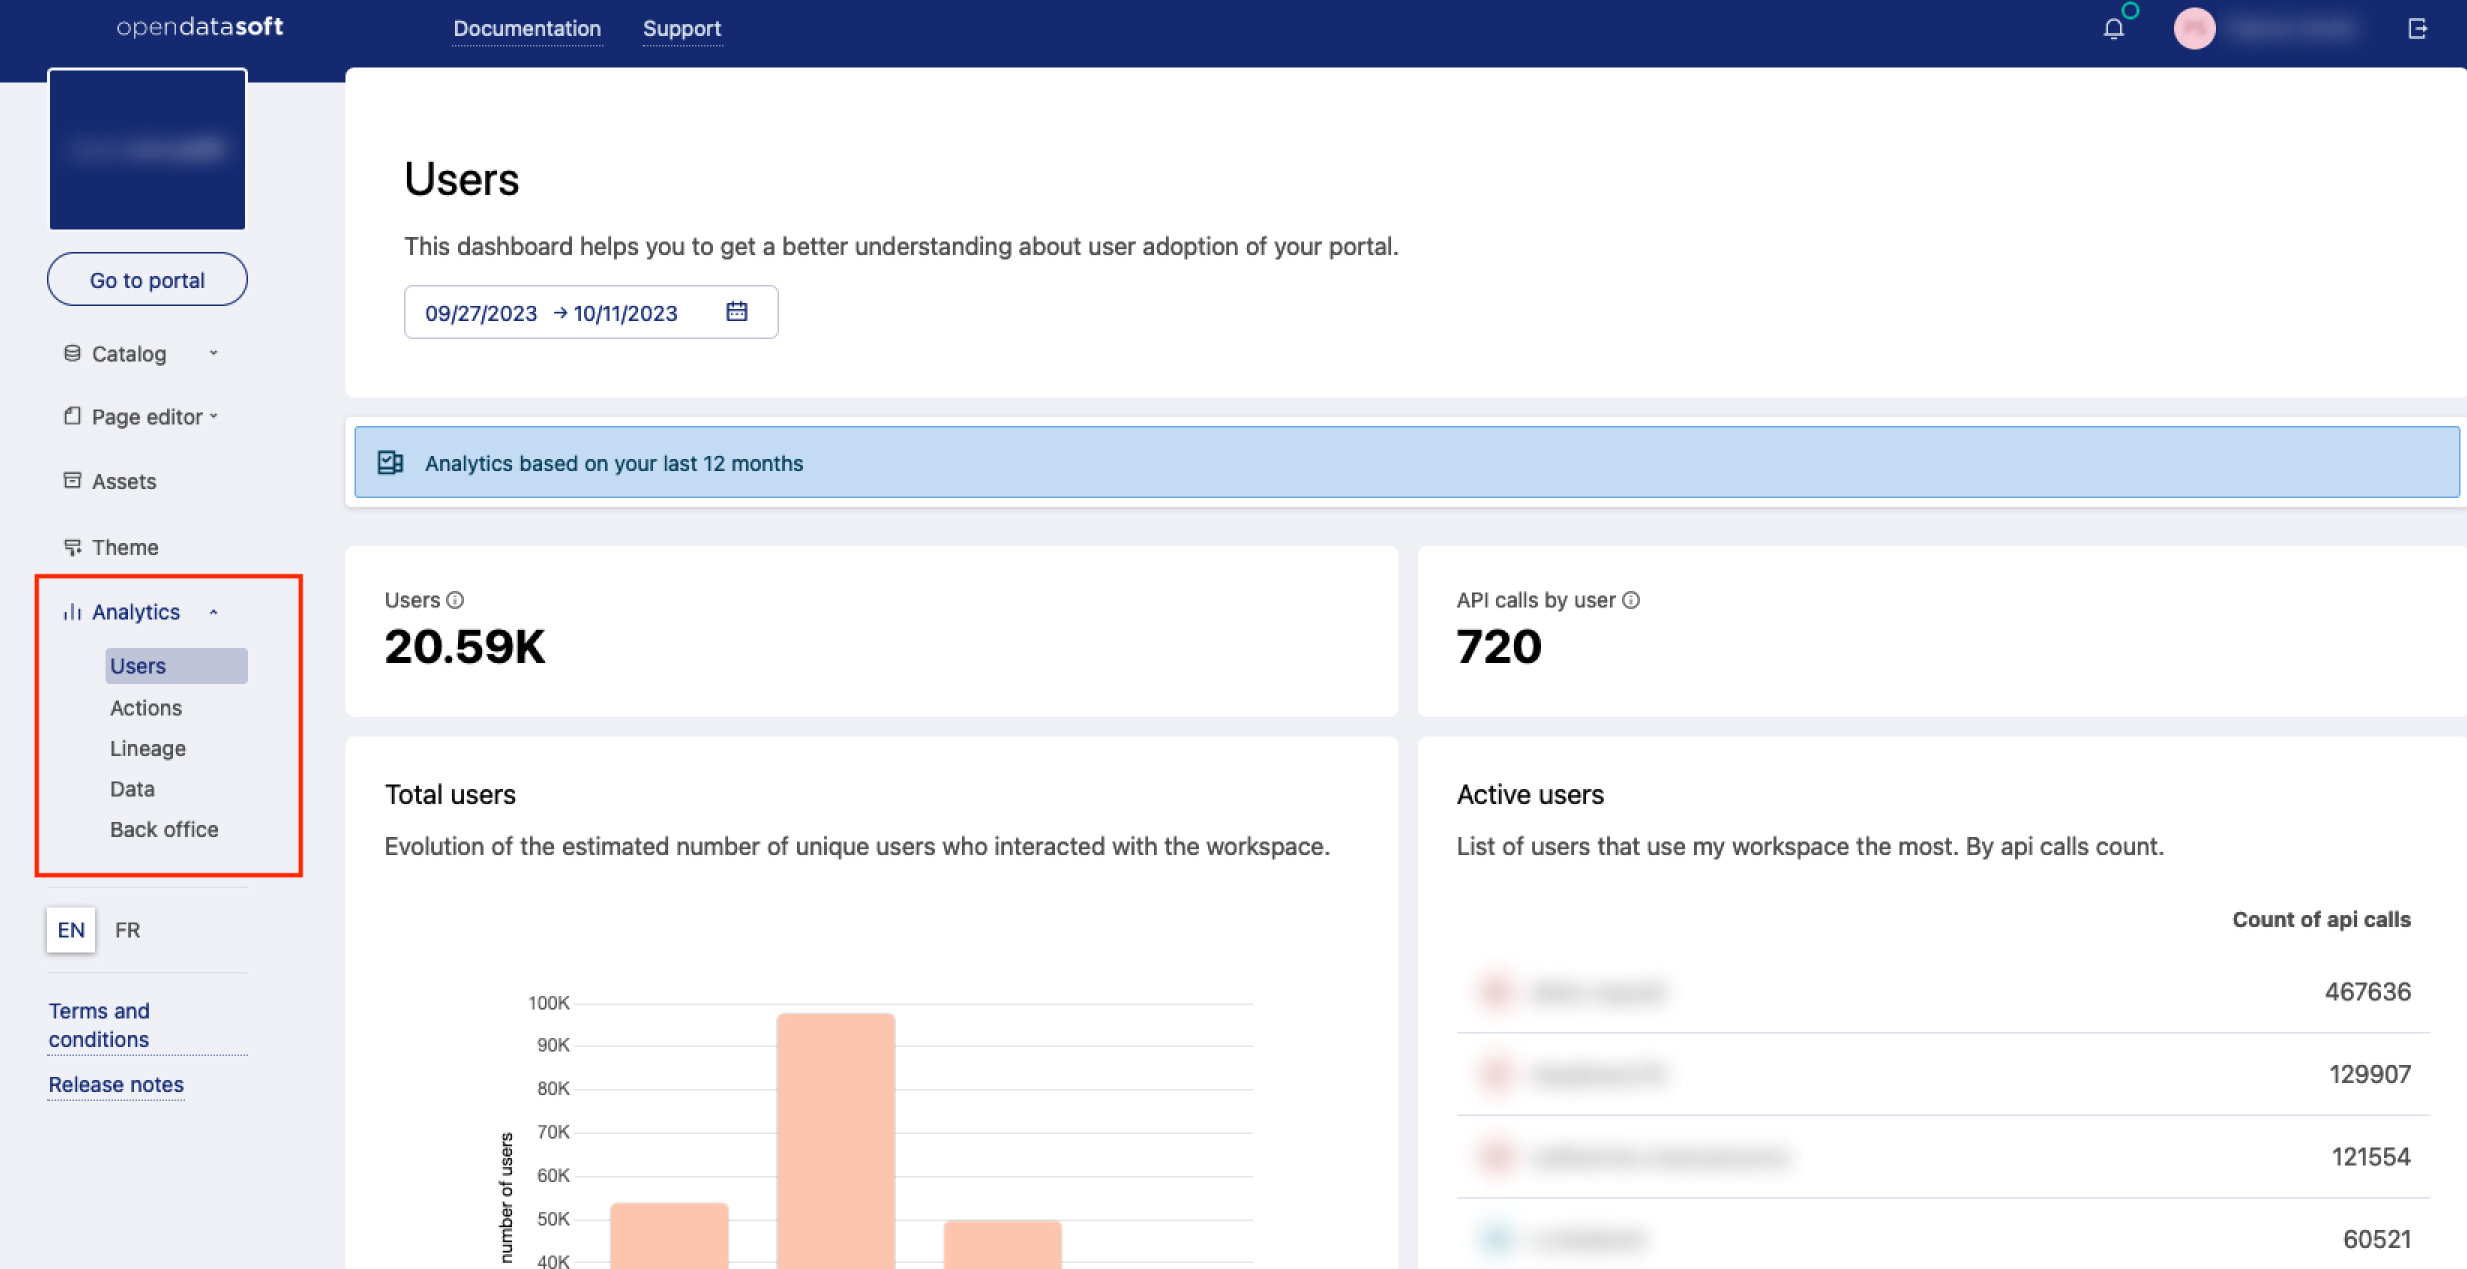
There are five analytics dashboards, each meant to give you insights about different aspects of your workspace. The links below take you to pages that discuss each dashboard in more detail.
But before jumping off into each of those, consider reading our quick entry below about API calls—a common measure for many statistics on these tabs—as well as a couple other things you'll find in these tabs.
Users dashboard: Who are the people using your data, and how are they interacting with it?
Actions dashboard: How is your data being accessed, searched for, and from where?
Lineage dashboard: A quick and comprehensive overview of metrics and data about your objects' lineage (also see our introduction to lineage).
Data dashboard: How popular are your different datasets, according to downloads and interaction metrics?
Back office dashboard: Where administrators can monitor their workspaces' user activity.
A key measure: the API call
A key measure for many of the statistics on your dashboards is the API call.
Every API call represents one request made to your data. Naturally, it can be made directly via the API, but really it represents any interaction with the data. For example, when you search for a keyword on a dataset, this generates a request, and so counts as one API call. Displaying a map or an analysis? An API call.
As such, the number of API calls is often the simplest and most direct measure of activity in your data.
The time period
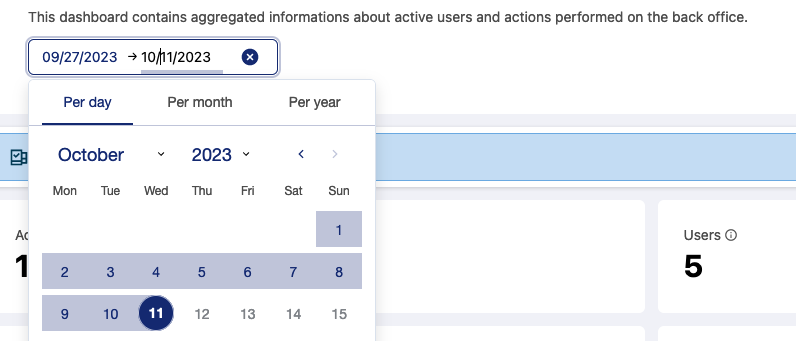
The Users, Actions, and Back office tabs all default to the past three months, but you can also select a different time frame for your analysis. In that case, the statistics displayed will adjust accordingly.
Note that the source datasets include usage data for at least the past three months, though older data is archived within the limits dictated by the law and our terms of use.
Source data and other features
Going futher with the source data
If the default figures and analysis are not enough for your needs, you can always download the underlying datasets to do your own analysis. The Analytics > Users and Actions dashboards are based on the "ods-api-monitoring" dataset. Analytics > Data is based on the "ods-datasets-monitoring" dataset. And finally, Analytics > Back office is based on the "ods-activity_log-monitoring" dataset.
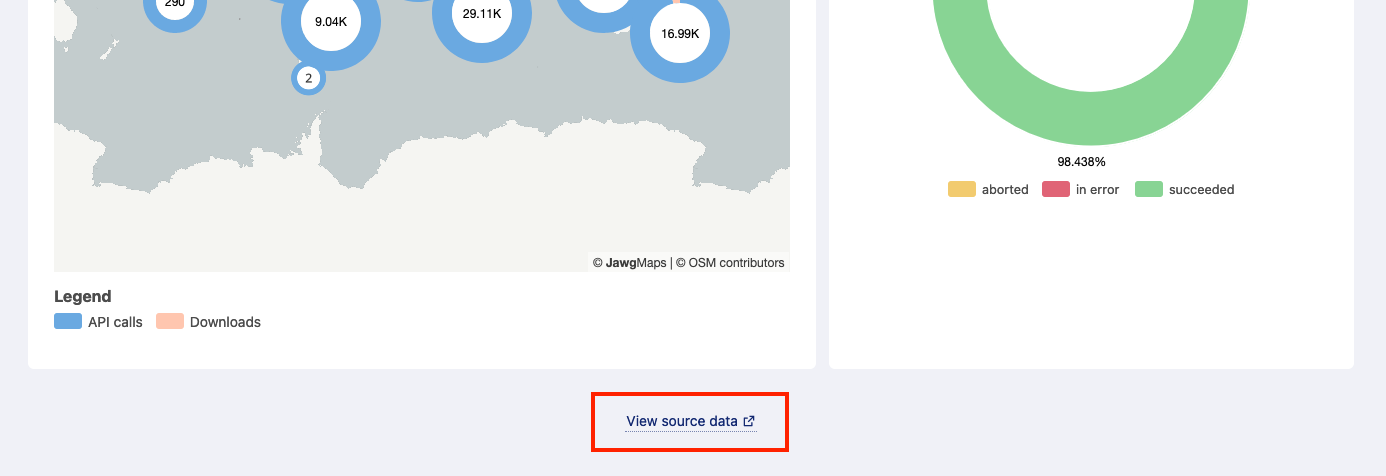
To access these datasets for your workspace, go to the relevant analytics dashboard, scroll to the bottom of the page and click on the link, View source data.
See this page for more information about the specific field values you're likely to use to analyze your data, and see here for instructions for one common usage of that data.
Secondary workspaces
If your primary workspace has secondary workspaces, a feature can be activated on demand that allows you to monitor these secondary workspaces through the main workspace's analytics.
When this feature is activated, a "Select workspace" filter is displayed at the top of the dashboard. In this filter, tick Secondary workspaces to take them into account in the monitoring dashboards. Note that the monitoring of secondary workspaces is only available for the Users, Actions, and Back office monitoring dashboards.