Analyzing actions
Users must have the "Browse analytics" permission to consult the Analytics dashboards.
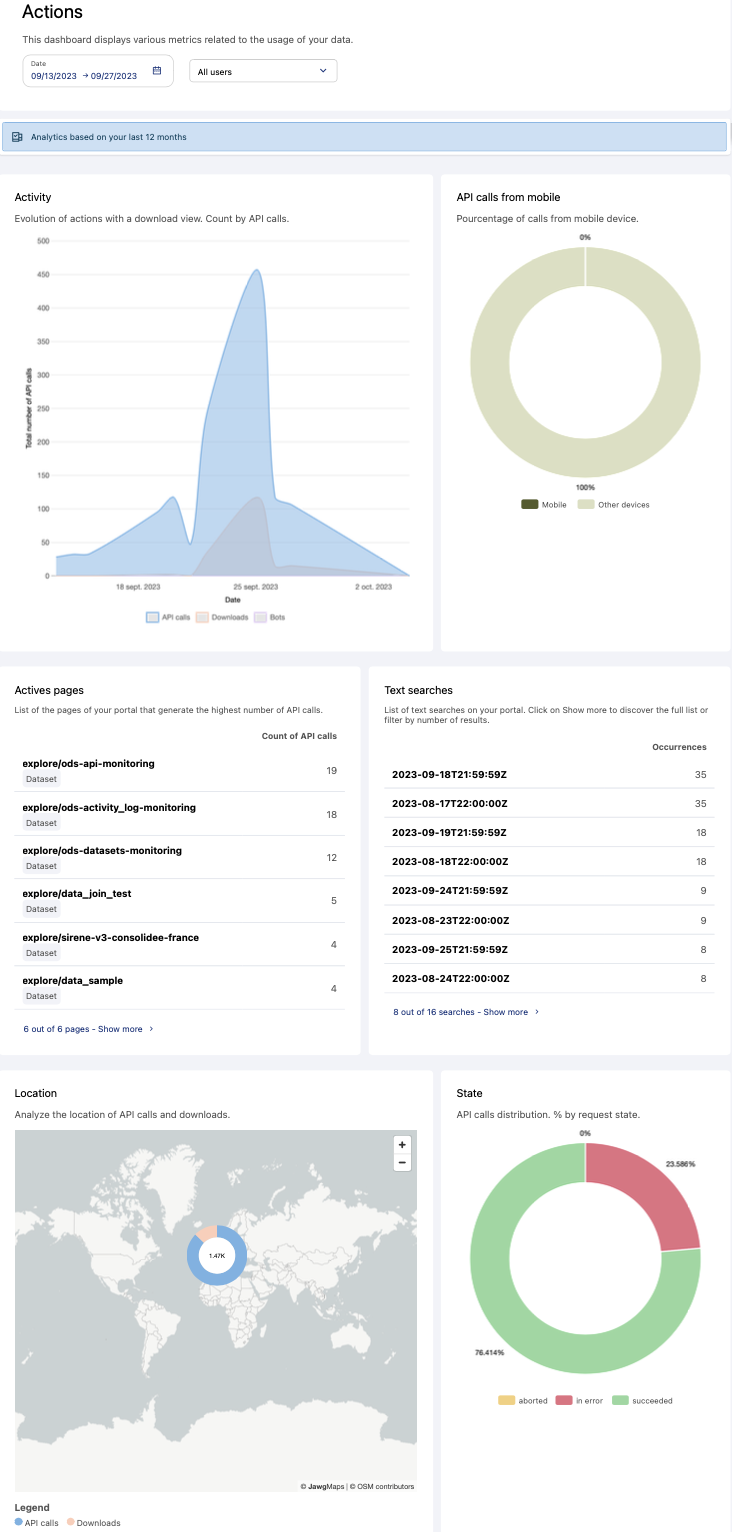
The Actions dashboard displays various metrics related to the usage of your data, based on API calls.
To see it, go to Analytics > Actions.
Filtering by date or user type
By default, the filter is set to a two-week period, but you can specify the time period you wish to analyze.
You can also filter the data by the type of user (users who are logged in or anonymous users). By default, the filter is set to show all users.
Understanding actions: what are people doing with your data?
Activity: The number of API calls over time, including the portion devoted to downloading datasets.
API calls from mobile: The share of activity generated by users using a mobile device compared to other devices.
Active pages: This presents the eight pages on your portal that generate the highest number of API calls. Click on the Show more button to access the complete list of pages with filtering and search options.
When you see explore/<dataset-id> (see the image below), it represents the number of calls generated by the tabs on a dataset page (table, map, analysis, etc.).
Text searches: This list presents the different search terms that have been used most often on your portal, both searches to find datasets in your catalog and searches to find records in your datasets.
Click on Show more to discover the complete list, as well as sort the data not only based on the number of times that term has been used, but also the number of results obtained using each term.Location: This map allows you to visualize the geographical origin of all API calls. Among those API calls, we indicate the share devoted to downloading datasets.
Note that IP geolocation is inherently imprecise, and this may be reflected in the map.
State: This chart allows you to evaluate the performance of API calls made over the chosen period (requests made successfully, aborted, or in error).
The underlying data
If the default figures and analysis are not enough for your needs, you can always click on the View source data link at the bottom of the page. See Monitoring your workspaces for more general information.
This underlyin dataset, called ods-api-monitoring, is based on the schema here. Each field name corresponds to a column in the data. For information about the values possibles for several important fields, see this page.


