How to transition to the new data marketplace experience
This page is here to guide you through your transition to the new data marketplace experience.
It provides a clear and concise overview of the key changes, as well as the new features you can take advantage of.
Especially, step-by-step, it will help you make the most of new improvements while navigating your workspace's evolution.
Reach out to your CSM if you aren't currently on the new experience and are interested in transitioning now.
The key changes and new features
The new experience takes your existing portal further, letting you operate a complete data marketplace.
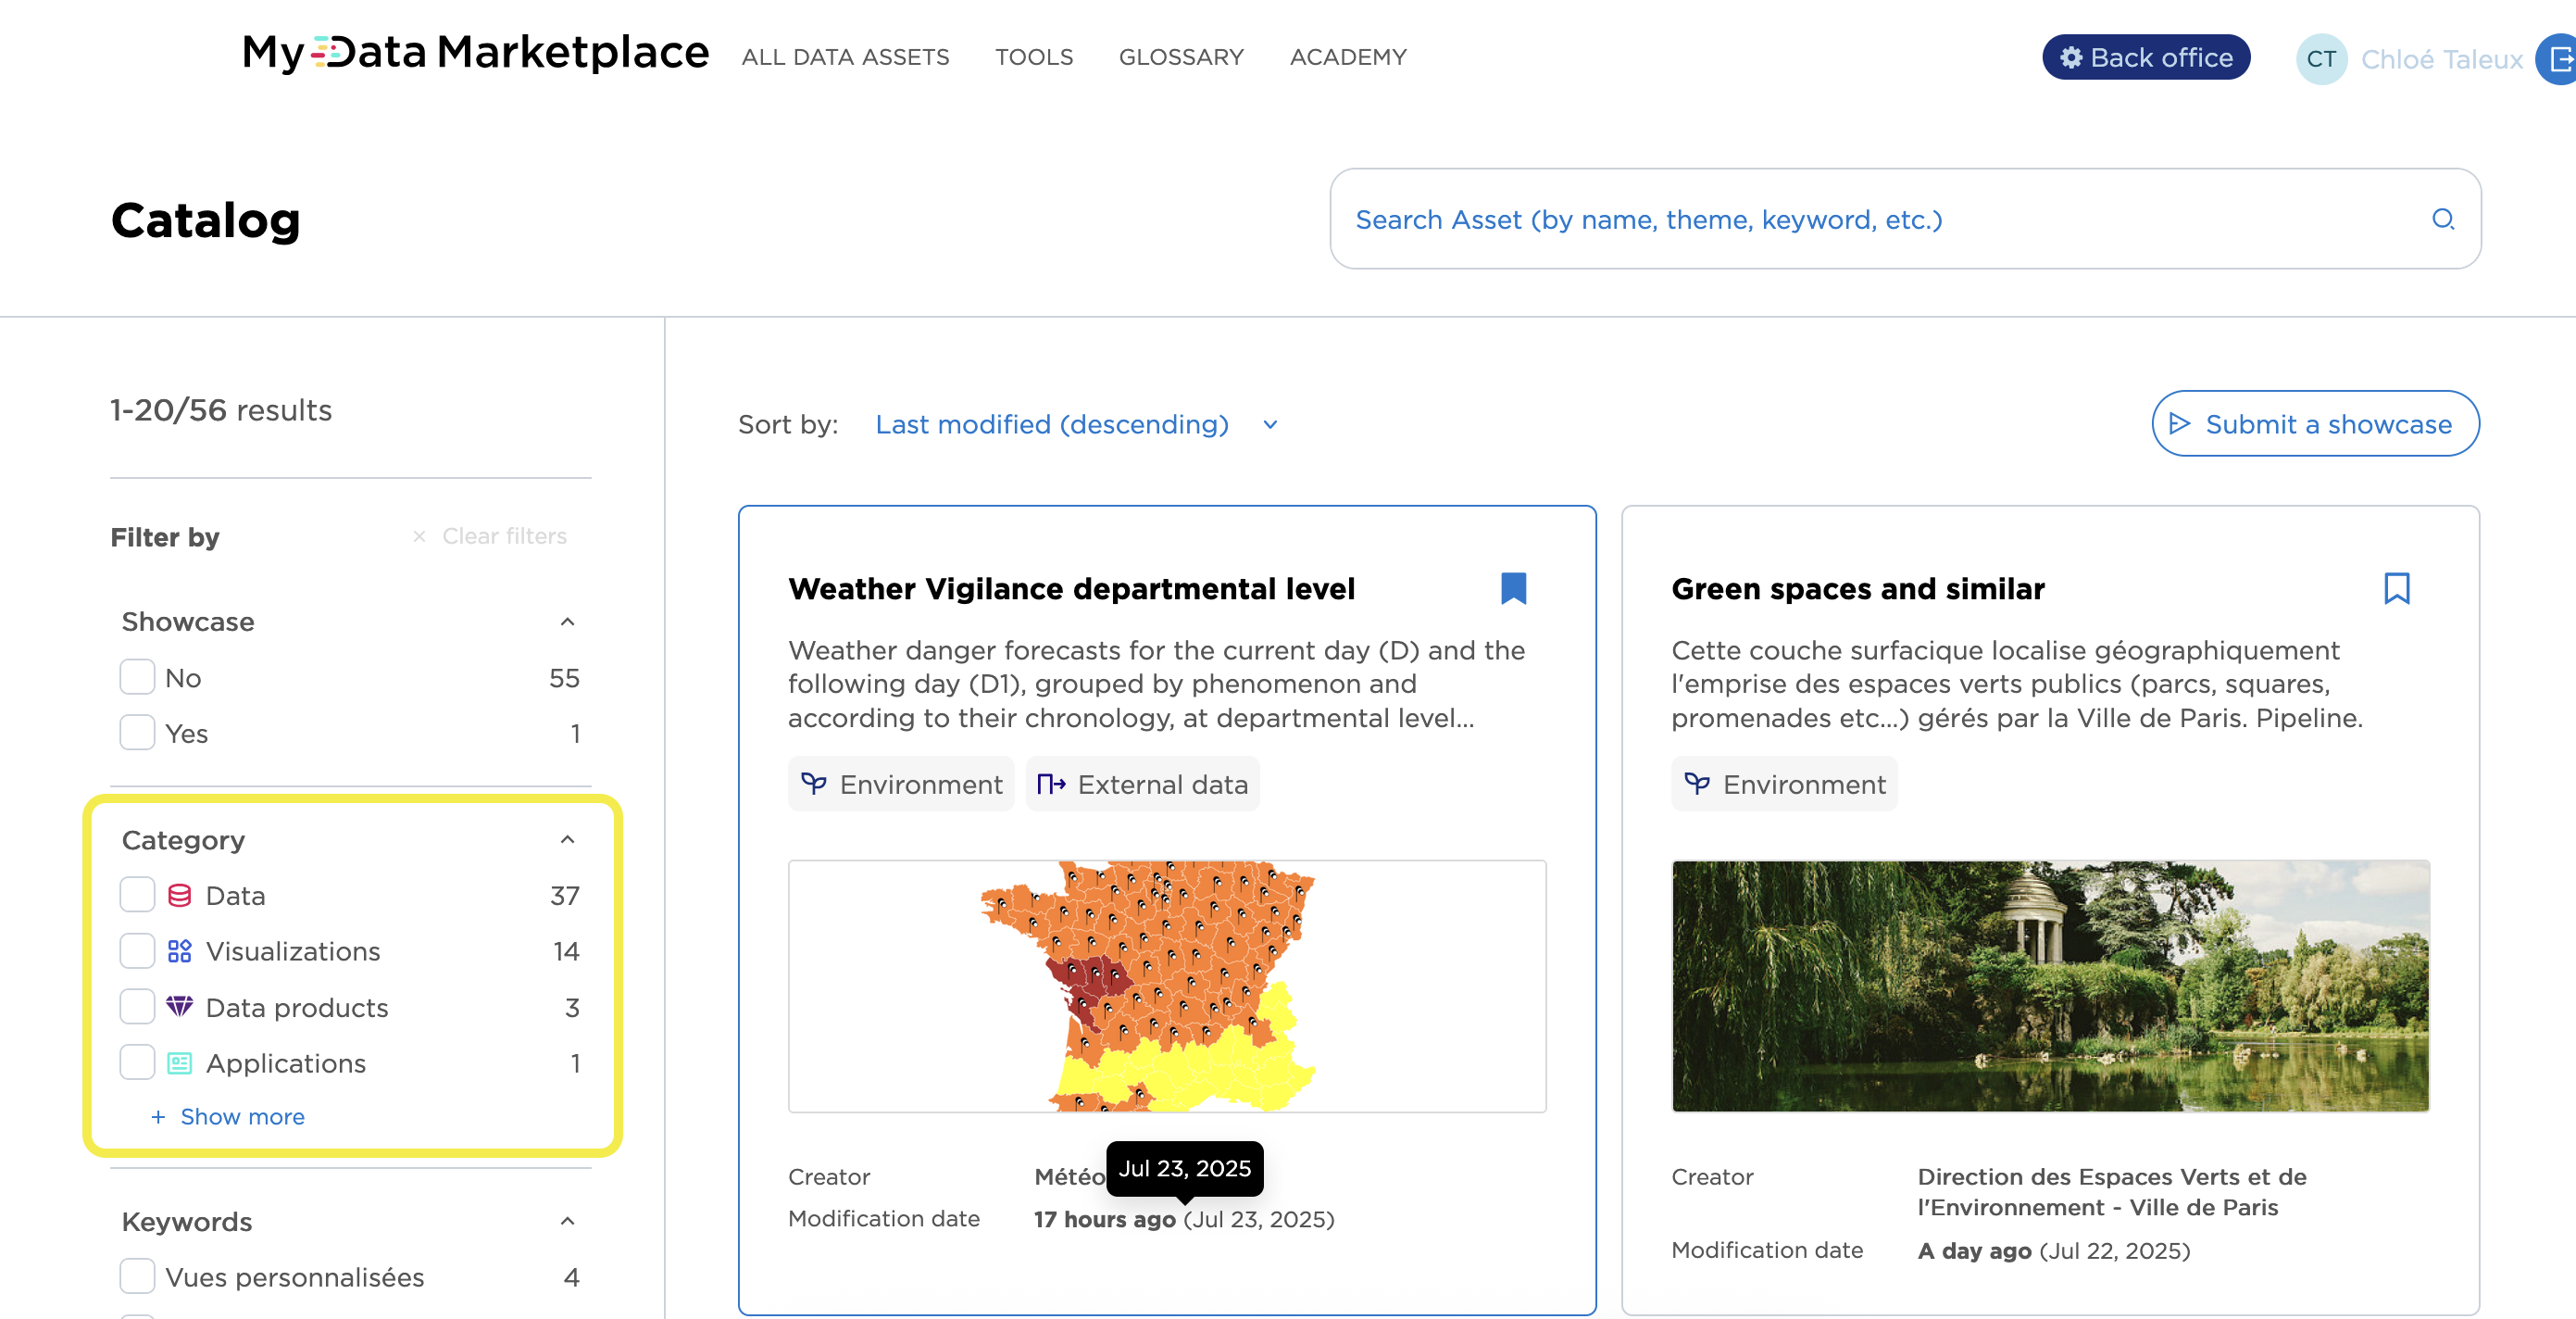
Beyond just datasets, now you can manage and share a wide selection of "data assets": data products, assets from data catalogs, BI reports, documents, and more.
We’ve redesigned the experience for both producers and consumers to give you more flexibility and control in managing all of your data assets.
Here’s a quick look at the key improvements:
Centralized management of all your data assets
Manage all your data and assets in one space, in a streamlined and organized way.New features
Build a business glossary, mark assets as favorites, manage access requests, and categorize assets for better organization.Streamlined access workflows
Use native request and approve flows, combined with fine-grained, role-based permissions, so that you control exactly who can find, preview, or consume each data product.
Navigating your workspace's evolution
The new experience is a richer and more powerful one. But that means that some things you're used to are changing.
This guide gives you a clear map of everything that will look or behave differently once you've activated the data marketplace experience on your portal.
Below is information about:
What’s mandatory (things that must change so that no existing element is broken)
What’s simply new or different (features, menus)
What’s temporarily missing (workarounds while we put the finishing touches on some features)
Think of it as your “no suprises” checklist. Our goal is for you to get every bit of value out of the new data marketplace experience, and without any pitfalls along the way!
1. What's mandatory: Legacy elements to migrate
Many domains can jump straight to activation, but if your catalog contains any of the items listed below, you’ll need to make some choices before the data marketplace is activated on your domain:
If you use custom views attached to datasets
Those who have been with us for a while know that custom views are nothing new, but over time they became a kind of Swiss-army knife, used for many different functions.
In the data marketplace, we’ve streamlined their role: Custom views now sit squarely in the asset-conversion funnel. They're fully measurable and give admins the insight they need to run an effective marketplace, all while making information easier for end-users to find.
You will know the click-through rate for each custom view
You can have up to 7 different custom views per dataset, in the order you define, with one set as the default
For clean metrics, there is one block per view
Views are built in our no-code Studio, each with its own title and icon
For more details, see the article in our Community.
⚠️ However, note that if you take no action, your legacy custom views will simply disappear from your portal when the data marketplace is activated.
Instead, choose one of the two paths below before going live:
Opendatasoft runs the auto-migration script to transform your custom views into code editor assets
What we’ll do
Recommended?
Your effort
We copy every legacy view into a new asset with the asset type "code editor page," and the default asset category "Visualization."
The content and metadata stay intact;
we add a “Visualization – <Dataset Title>” prefix and back-links in the dataset’s description so users land in the right place.
The linked dataset or visualization is displayed in the "Similar assets" section.- If your legacy views are true custom views (ie. they highlight the dataset itself).
- If you have many views or no time to review them one by one.Just give us the green light.
Rebuild your custom views with the new feature
What we’ll do
Recommended?
Your effort
You recreate each relevant view using the new feature (Dataset > Edit content > Custom views), taking advantage of the new metrics, titles, and icons.
- If you want to clean house and curate your data marketplace.
- You prefer to redesign or drop views that no longer add value.A few minutes per view, depending on complexity.
Let your CSM know which path you prefer so we can schedule the migration and keep your former custom views visible from day one.
If you use reuses
Reuses were our first way to spotlight what people built with open data. With the data marketplace, we’re broadening that idea and introducing showcases:
Showcases = assets
Each showcase is now a catalog asset (flagis_showcase
), with the same permissions, metadata, and visibility controls as datasets.Works for any data
Everything fits: Open-data projects, private dashboards, internal Power BI reports.Can link to several datasets
A single submitted showcase can reference multiple datasets in the data marketplace.Better catalog integration
Showcases appear in search, lineage, and usage metrics, just like any other asset.
Need the full story? See the relevant post in our Community.
If you activate the data marketplace without migrating, the reuses won’t be available anymore, and the
ods-reuses
widget won’t display any objects, because it will list only showcases.
Instead, choose one of these two options before going live:
Let us run the auto-migration script
What we’ll do | Recommended? | Your effort |
Every Reuse becomes an asset with the propriety Showcase. | You have many Reuses or little time. | Just give us the green light. |
Handle your reuses manually
What we’ll do | Recommended? | Your effort |
You rebuild each project as a showcase (or decide to drop it), using the new asset form. | You want to clean up or reorganize your data marketplace, or some reuses are outdated. | A few minutes per showcase, depending on their complexity. |
Let your CSM know which option you prefer so we can schedule the migration and keep your former reuses visible from day one.
If you use calendar and images views
In the data marketplace experience, calendar and image views tabs will no longer be available due to low usage and limited value. What can you do?
Situation | Action to take |
Low usage or value | Delete calendar or image views if they haven’t served a clear purpose or haven't seen much engagement. |
Still valuable | Turn them into a structured asset in the data marketplace, possibly combining multiple views into a single asset for a better user experience. |
If you’ve hidden columns on datasets
In the data marketplace experience, you can no longer hide columns directly in the table view of Explorer.
Previously, there were two settings:
The dataset security configuration, which makes the data available or not in the API (and thus in the front end), under Security.
The column visibility configuration in the Table view, which only affected the display in the front end, via Visualizations > Table.
This improves both data security and transparency, because previously there was the potential for confusion and potential data leaks if columns were hidden in the front end but still available through the API.
Now, visibility is controlled only via the dataset’s security settings.
What to do with your hidden columns?
Situation | Action to take |
---|---|
Sensitive fields | If you hid columns for security reasons, manage these through the dataset's security settings, not visibility. |
Non-relevant fields | Remove the column from the schema if it doesn't need to be visible or is just intermediate data. |
Less important columns | Move the column to the far right of the table for less prominence if it's useful but not essential for front end display. |
Editorialized tables | Create a custom view if you need a specific view with filtered, sorted, or limited columns. The full Explorer will remain available, but you can control the first view with full flexibility. |
If you're unsure whether any of your datasets have hidden columns via the Visualizations > Table setting, your CSM can confirm and provide you with the datasets that need adjustments. You’ll be able to manage these changes on your own.
2. What’s new or different?
The data marketplace upgrade is more than a facelift—it turns your portal into a true catalog of data products.
You can now register any kind of asset (datasets, dashboards, apps, documents, ML models, and more), slot them into curated categories to tell a story, and enrich them with a business glossary that speaks your users’ language.
Each asset can carry its own call-to-action—Request access, Open in BI, Download CSV, and so on—guiding users to the next step instead of leaving them guessing.
Behind the scenes, an enhanced analytics funnel tracks every stage of the journey—from search, to click, to API calls—so admins get a clearer view of what’s working and what isn’t.
We won’t go through the entire feature set here. Instead, this section zeroes in on what feels different compared with the old interface. What has moved? What changed? What was simplified or retired?
Catalog customization
The global stylesheet isn’t going away, but anything you can now do in no-code settings has been lifted out of CSS. When activating the data marketplace, you can redesign the catalog theme—layout, buttons, catalog cards—straight from the back office under Portal > Style.
Why the change?
A more modern UI, always up to date
Fewer hard-coded overrides mean we can ship interface improvements without breaking your look and feel.Admin-friendly maintenance
No more digging into CSS. Branding tweaks take minutes, not deploys.Best-practice personalization
High-impact options (colors, spacing, badges) are available in the editor; deep custom hacks stay in the stylesheet for edge cases only.
As we add more no-code controls, the stylesheet will cover less and less, keeping your marketplace customizable and upgrade-proof.
See the article in our Community for more details.
Sort and filters options on your catalog
Head to Catalog > Settings and you can now:
Turn any metadata field—standard, custom, or DCAT/interop—into a catalogue filter
Choose a default sort order for search results
To keep things simple—and also because almost nobody used them, the legacy default sorts by "record count," "downloads," and "popularity" have been removed.
Chart Builder & Map Builder
The familiar Chart Builder and Map Builder aren’t going anywhere for now, and you can keep using them exactly as before. However, longer term they’ll probably be replaced by a “playground” directly in the portal: end users will be able to create their own visual assets in a private workspace and submit them to an administrator for publication in the catalogue as full showcases, if relevant.
Pages menu
The old “Menu Pages” section is gone—Studio pages and Code editor pages are now full assets, just like datasets.
They appear in the global Assets list in the back office and inherit the full metadata model, plus the user and group visibility rules.
Because they now carry metadata, they show up in the portal search and filters. Users can find the right page with a keyword or tag instead of hunting through menus.
Usage analytics are tracked the same way as for any other asset, so you see exactly how often each page is viewed.
One caveat: the “Last edited by” label is temporarily missing for pages, but it will return once it’s consistent across all asset types.
Dataset statistics
The one-click “Statistics” button that used to sit next to each dataset is gone.
Analytics are now grouped under the dataset itself:
In the dataset, go to Analytics > Activity.
Same figures, cleaner path—designed around how users actually consult usage data today.
Asset page
The asset page is the bridge between the data marketplace and the underlying data.
It displays the asset’s key metadata in an e-commerce-style layout (title, description, quality, license, similar assets, etc.) so users understand data before they consume it, and administrators decide which calls-to-action appear—Export, Explore, Request access, and so on.
In short, it presents the right context to end-users while giving admins full control over which actions are promoted. Page views, CTA clicks, bounce rate, and conversion funnel metrics are all captured, giving you hard data on what resonates and where users drop off.
Dataset of datasets
There is no change for now—the “dataset of datasets” still behaves exactly as it did in the previous experience. However, it will eventually upgrade into a broader “dataset of assets.”
Analysis and maps views
A portal's Analysis tab has been retired because it overlapped heavily with custom vViews—confusing editors—and, since it wasn’t treated as an asset, its engagement couldn’t be tracked.
For admins: If you need a curated chart or table as the landing view, build it with the new custom view feature (there’s no automated migration).
For end users: A new “playground” tool will soon appear in the portal, letting users create quick visual insights on a dataset—without leaving the data marketplace.
Territory metadata
The old “Territory” filter let users pick an area on a map and instantly narrow the catalogue to datasets tagged with that territory. That dedicated filter is no longer available, and we haven’t decided whether to rebuild it in the same form.
A workaround: Add a custom "Territory" metadata field to your datasets and expose it as a standard catalogue filter by going to the back office, then Catalog > Settings. Users will be able to filter by name (not by map).
3. Features still in the pipeline
A few familiar capabilities from the old experience haven’t yet landed in the data marketplace. They’re either being re-engineered to fit the new “asset-first” model, or they're being evaluated for better alternatives.
We know these gaps matter, and we’ve prioritized the most widely used capabilities first, and queued the rest for upcoming releases!
Disqus
The old Disqus comments tab—which let you embed an external discussion thread on each dataset—has been retired. A built-in commenting feature is in the roadmap, so producers and consumers will soon be able to exchange feedback directly inside the data marketplace.
Language-dependent column display
The old experience let you show or hide specific dataset columns depending on the portal’s language. That setting isn’t available yet, but it’s in the roadmap and will return in an upcoming release!
Dataset subscriptions
The “subscribe to a dataset” feature—automatic alerts when a dataset changed—is currently not available. It will be re-imagined as part of the upcoming producer-to-consumer interaction feature, giving users a smarter way to stay informed about updates.
Social sharing
The “Share” URL hasn’t been added yet to the data marketplace experience. It will come back as part of a larger sharing module that lets users promote an asset not only on public platforms, but also inside their organisation via tools such as Microsoft Teams, Slack, and other internal channels.