
Analyzing user activity
Users must have the "Browse analytics" permission to consult the Analytics dashboards.
The Users dashboard helps you to get a better understanding about user adoption on your portal.
The Users dashboard
To see it, go to Analytics > Users.
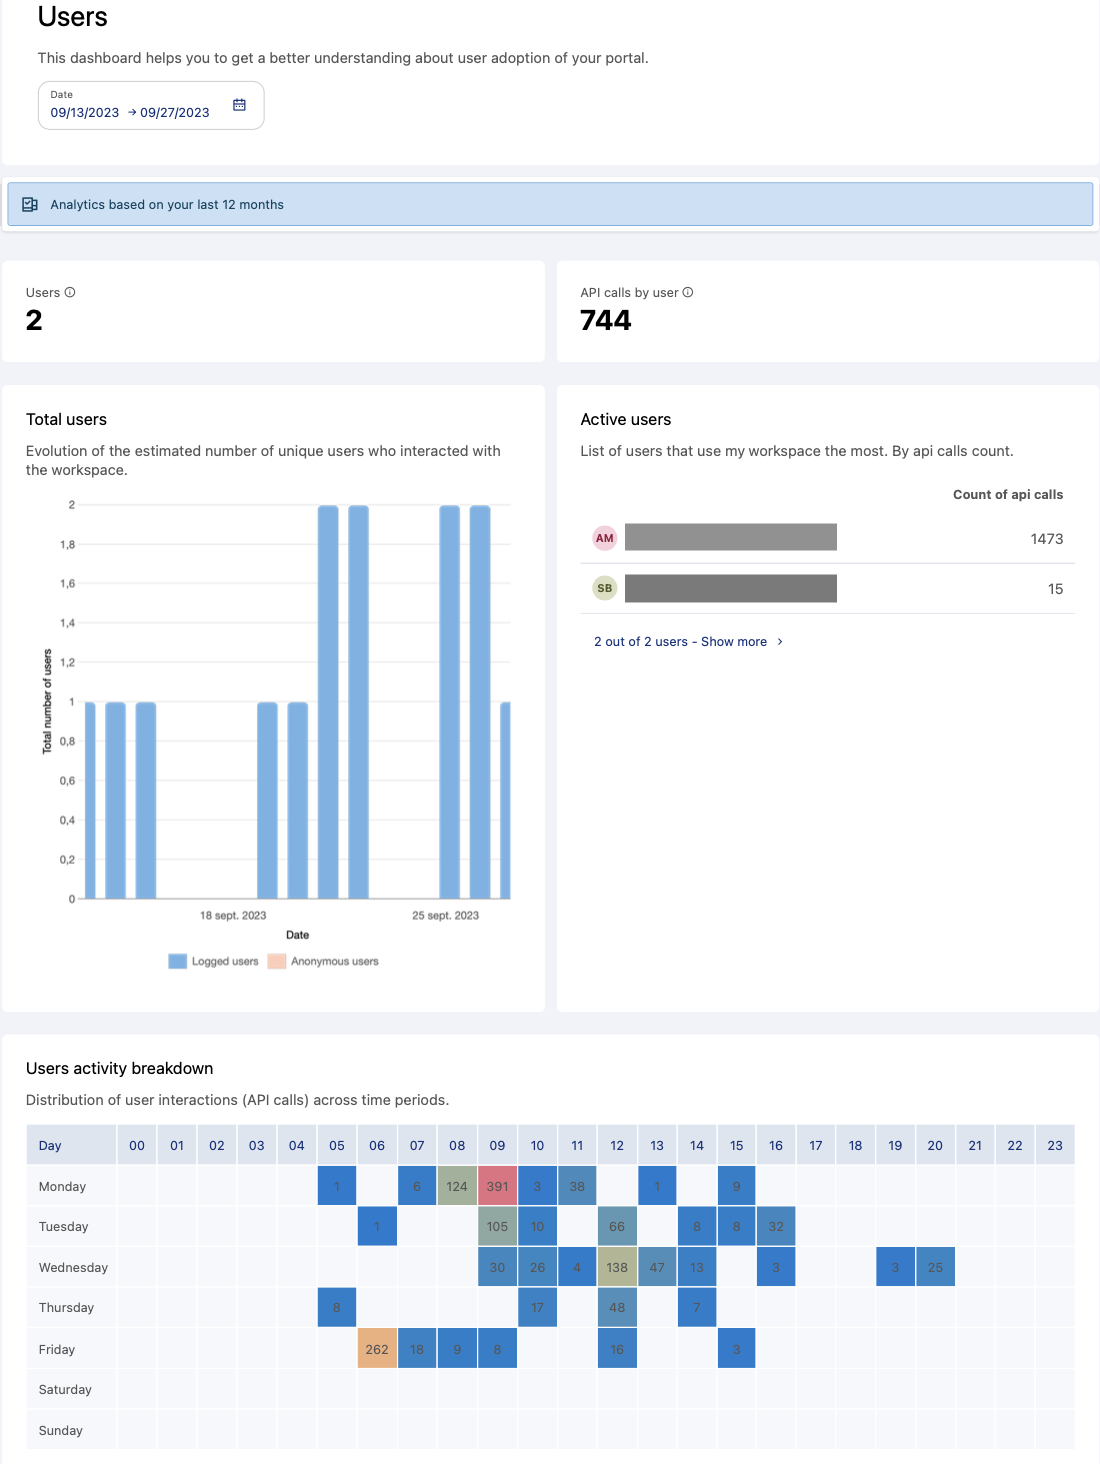
Filtering by date
By default, the filter is set to a two-week period, but you can specify the time period you wish to analyze.
Please note that access to your statistics is limited in duration. The maximum duration available is 12 months, but the duration that applies to you is determined by your plan or license. Your domain's current duration is indicated at the top of the Users analytics page, just above the date picker.
Key indicators
Users: Estimated number of unique users who interacted with the workspace.
Note that we use the count of logged users (field user_id with an identifier). An anonymous visitor corresponds to the distinct counting of IP addresses when the user_id has the value "anonymous." As such, this type of counting does not provide an accurate user count, but does provides a broad measure of how much user activity there is on your workspace.
API calls by user: The average number of API calls per user for the designated period.
Understanding your user activity
Total users: This chart displays the evolution of the estimated number of unique users who interacted with the workspace by user type in the selected period and by time interval (logged-in or anonymous users).
Active users: This table lists the eight users who use my workspace the most, based on their total count of API calls. You can click to see the full ranking. We group anonymous users into a single line in the table to get the volume of API calls.
Users activity breakdown: This presents the total number of API calls, per hour and per day of the week, over the period of time you've chosen. This allows you to see when users are most active on your portal.
The underlying data
If the default figures and analysis are not enough for your needs, you can always click on the View source data link at the bottom of the page. See Monitoring your workspaces for more general information.
This dataset, called ods-api-monitoring, is based on the schema below. Each field name corresponds to a column in the data. For information about the possible values for several important fields, see here.
Field name | Field description | Facet |
| Timestamp of the event | No |
| Remote IP address | No |
| HTTP request host name | Yes |
| User identifier | Yes |
| SSO identifier, if the SSO is activated | No |
| Dataset identifier | Yes |
| Domain identifier | Yes |
| API type (see this page for more information) | Yes |
| API name (see this page for more information) | Yes |
| HTTP request query string | No |
| HTTP request custom headers (see below) | Yes |
| HTTP response format | Yes |
| Response content size in bytes | No |
| Number of results | No |
| Full processing time | No |
| If the request was aborted | Yes |
| List of facets used | Yes |
| If the request processing generated an error | Yes |
| Error message | No |
| Attachment identifier | No |
| Image identifier | No |
| HTTP request user agent | No |
| HTTP request referer | No |
| Embed type (see this page for more information) | No |
| Embed referer | No |
| Parent workspace when the call is made from a secondary workspace | No |
| Geo coordinates (geoip on field user_ip_addr) | No |
| List of fields used in a full text query | No |
| Free text in a full text query | No |
| If the query was used by a bot | Yes |
| If the query was made from a mobile device | Yes |
| Category of the API query. The category is determined by keeping the first word of the "api" column. An exception is made for the "geo" category which contains API names that start with "get". | Yes |
| If the request was made as part of a federation. All queries that have the API name "category remote_redirect" fall under this category. | Yes |
| Additional information about the origin of the query, for example the fact that the call was made from a studio page. If the column is let empty, the call was not made by the ODS platform but by an external application. | Yes |