
How to limit who can see your visualizations
When creating pages using Opendatasoft widgets, there is a very simple way to limit who can see each visualization depending on whether users are logged into the portal or not.
Using the user's login status
You can limit the visibility of charts or other visualizations according to a user's login status.
To do so, simply add the ng-if="user.is_authenticated" property inside the tag of the widget you want to display only for logged-in users.
An example
Let's take the example of two graphics, the first one being visible to all users and the second one only to logged-in users.
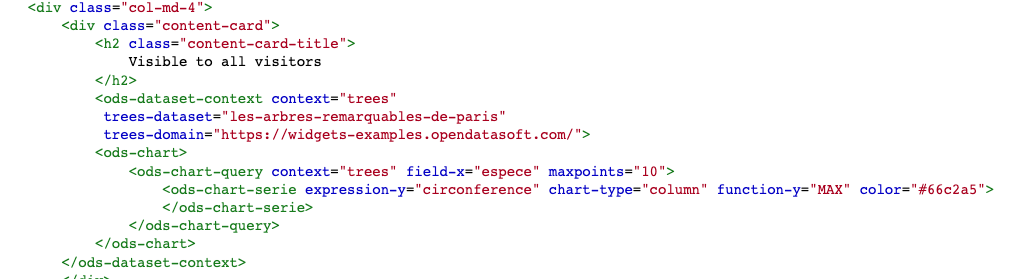
For the first graphic, nothing special:
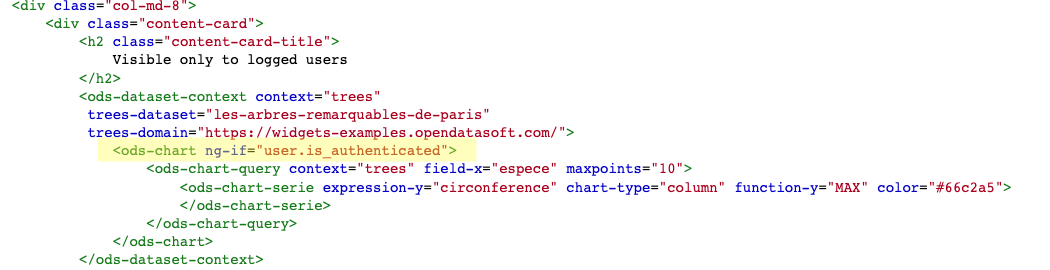
For the second graphic, we add the ng-if="user.is_authenticated" property:
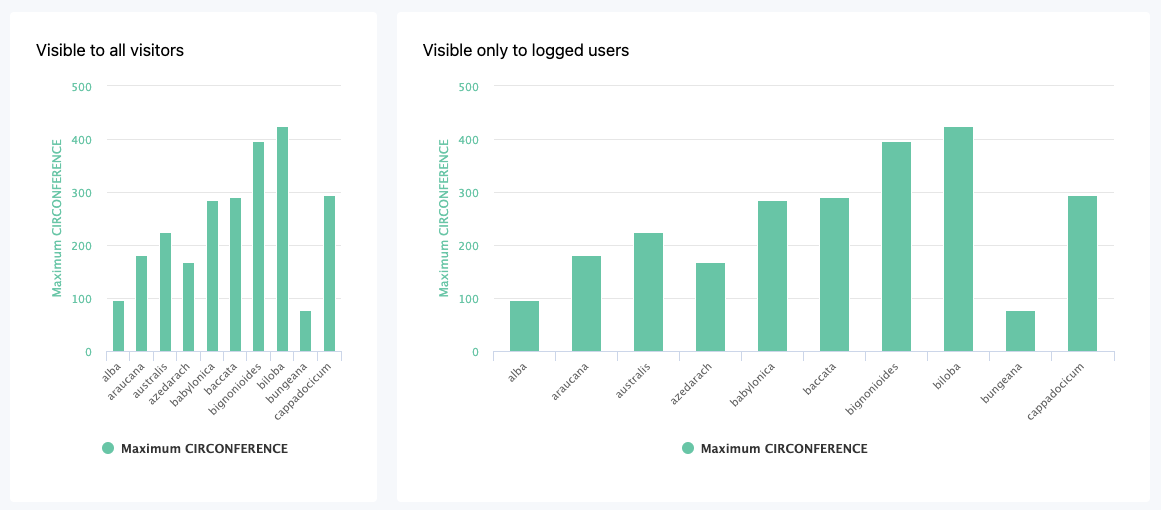
The view for the connected user will be complete:
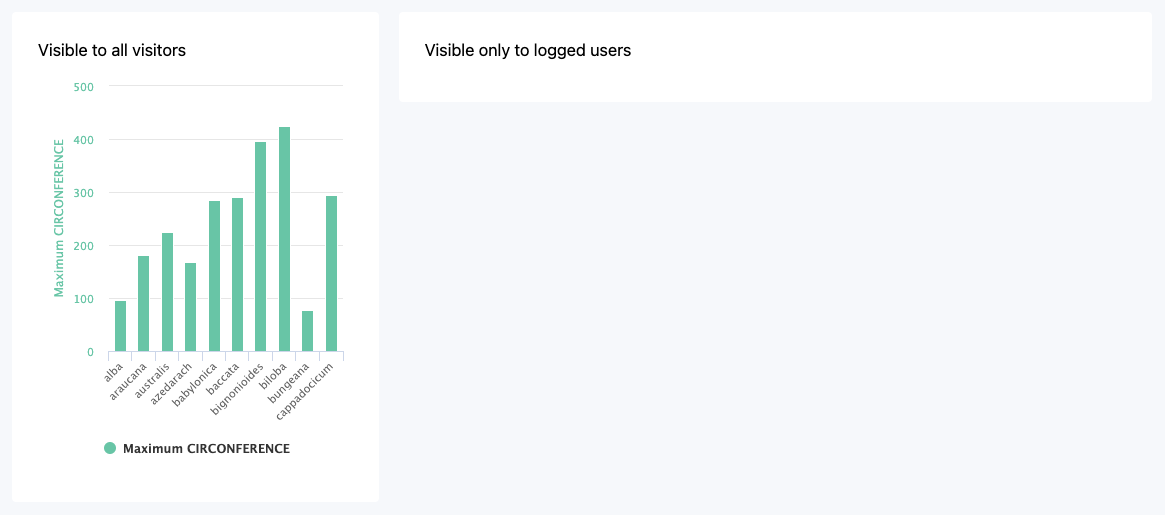
But for users who are not logged in, the second graphic will not appear:
With this trick, it's easy to limit who can see your visualizations, case by case, even on the same page.