
Managing saved visualizations
To manage your saved visualizations, first go to your account by clicking on your account name in the upper-right of your workspace. There on the Visualizations tab, authenticated users can see the list of visualizations created and saved using the Map Builder and the Chart Builder.
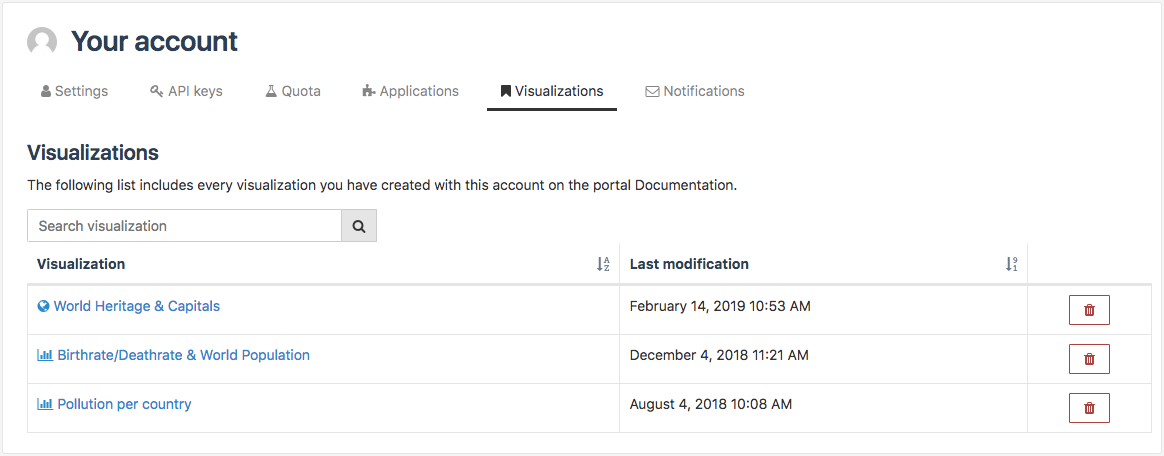
The visualizations are listed in a three-column table:
The "Visualization" column contains the name of the visualization, preceded by an icon that indicates whether the visualization is a map or a chart.
The "Last modification" column indicates the date the visualization was last modified.
The last column contains trash buttons you can use to delete the visualizations.
If you have a large number of visualizations, remember that you can use the search bar above the table to search for specific visualizations to avoid scrolling through the list.
Editing a saved visualization
In the list of visualizations, click on the name of the visualization to edit it.
Edit the visualization in the Map Builder or the Chart Builder.
Save the visualization again. The "last modification" date for that visualization should update to reflect this.