
Adding a key performance indicator (KPI) in Studio
In Studio, you can use a key performance indicator (KPI) to translate one phenomenon that lies within data into a simple message. There are three types of KPIs available in Studio:
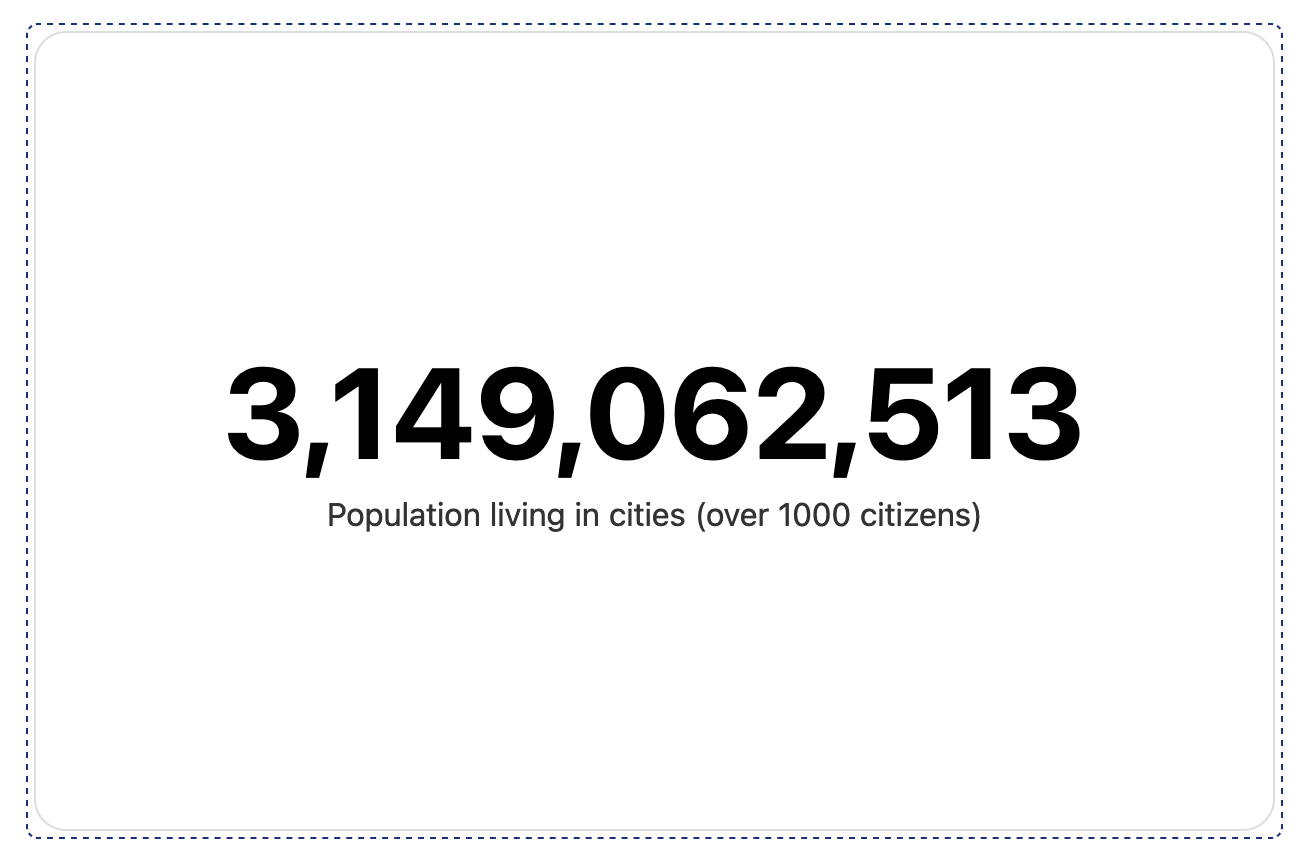
Simple KPIs highlight a piece of information. For example, you can create a simple KPI to show the sum of inhabitants in the city in 2021.
Comparison KPIs compare two subsets of data or two populations. For example, you create a comparison KPI to show the evolution of bike users over time by comparing the number of bike users between 2020 and 2021.
Ratio KPIs gives the proportion of a population within a larger one. For example, you can create a ratio KPI to know the percentage of women in the total population of your country.
We recommend that you follow some key principles to build clear KPIs:
A KPI must convey a single message so that a single indicator is emphasized.
A KPI needs some context so that anyone browsing the page can understand what the KPI is related to.
A KPI must be meaningful. If you add a picture, a pictogram, or colors, it must serve the message you want to convey.
Step 1: Select the block type
You need to define the block type before you can configure the content you want to add.
From the preview pane, click the block you want to edit.
From the left side pane, select KPI as the block type.
Click Next.
If you change your mind, you can change the block type afterward. The block configuration will be reset after you change the block type.
Step 2: Select the dataset
Select the source dataset to create a graphic representation of the data.
The dataset is only selected for the current block. If you add some content to another block afterward, you will need to select an input dataset again.
From the left side pane, select the desired dataset from the list.
A preview of the first 20 records opens in the preview pane.
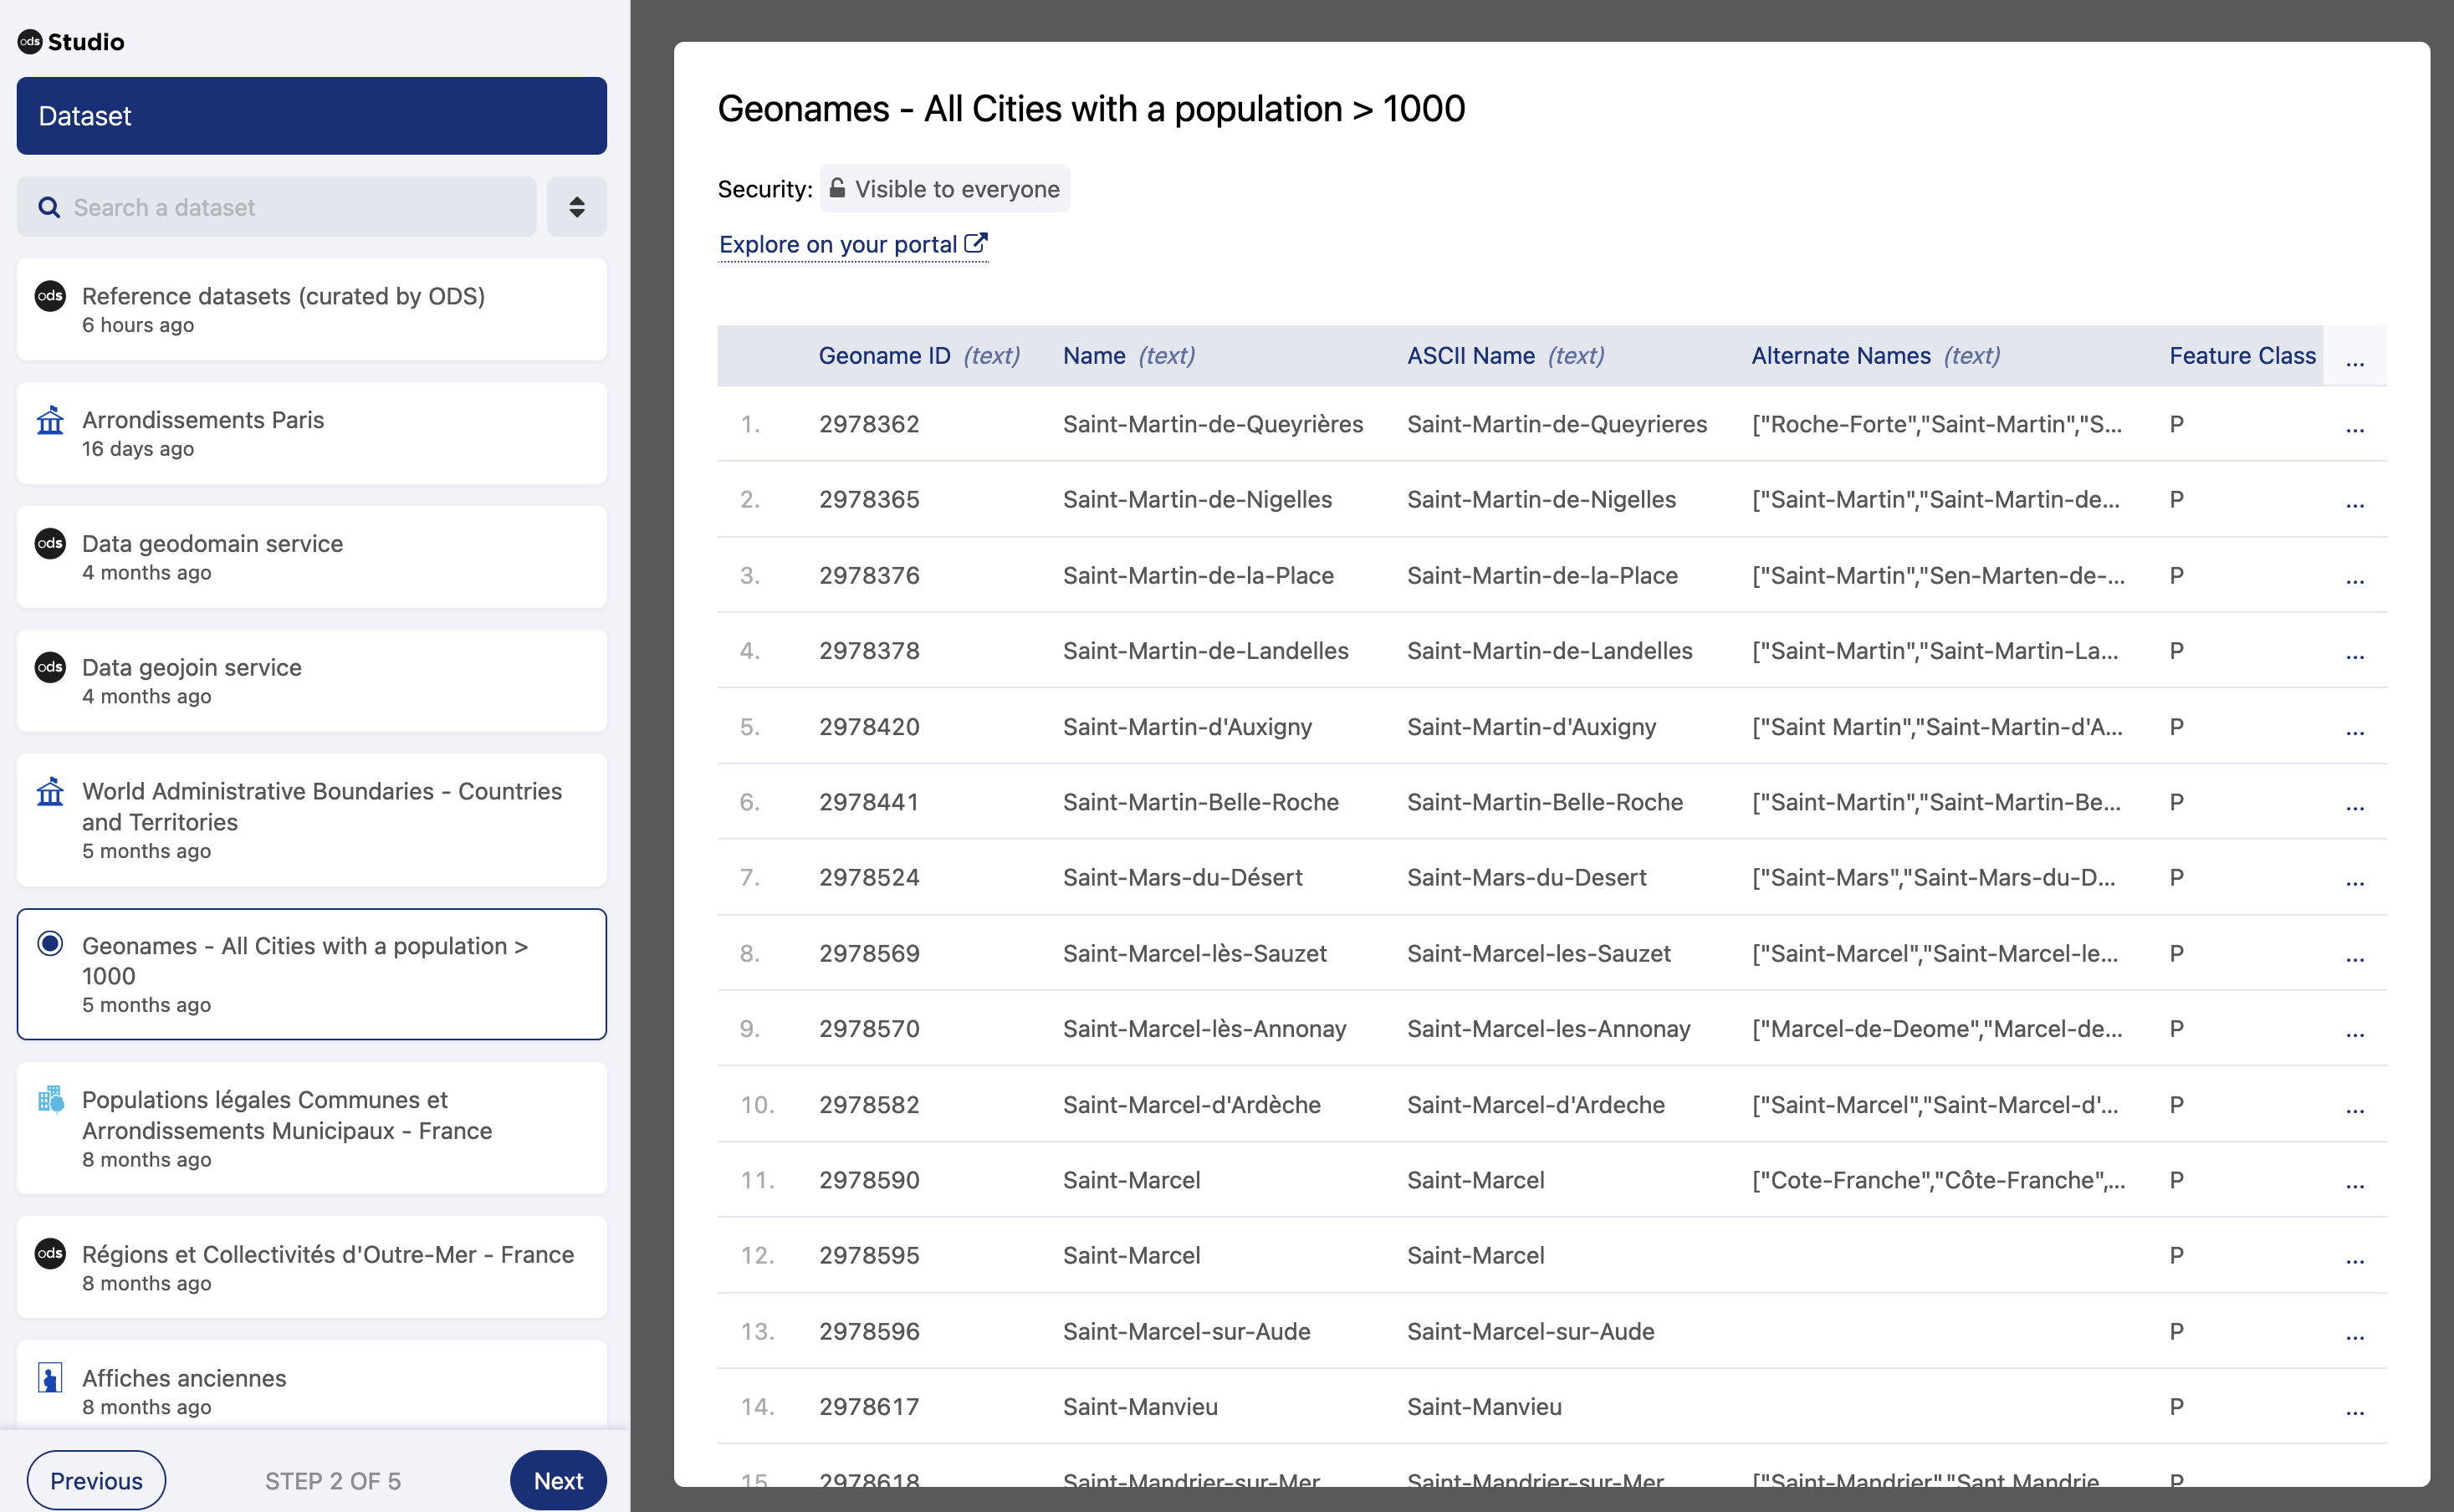
Click Next to continue with the configuration.
Step 3: Select the KPI type
After selecting a block type and the input dataset, you can now select the type of KPI to be inserted into the block.
From the left side pane, select Simple KPI, Comparison KPI or Ratio KPI.
Step 4: Configure the visualization parameters
Configure the visualization parameters for a simple KPI
From the left side pane, select the function to apply and the field to be used for value computation. When using a date field, select the time scale to be used.
You can also refine the data shown on the KPI:
Click Add a condition.
Select the field from the input dataset.
Select an operator. Depending on the field type, the available operators may vary.
Click Confirm.
For more information, see Refining data.
(optional) In the Unit field, you can enter the unit associated to the indicator. By default, this unit is placed on the right side of the indicator. You can place it on the left by using the swap toggle.
Click Next to continue with the configuration.
Configure the visualization parameters for a comparison KPI
When creating a comparison KPI, you create two sets of data so that you can compare them between each other and identify differences.
From the left side pane, select the function to apply and the field to be used in the first set of data.
You can also filter or refine the data shown on the KPI:
Under the desired set, click Add a condition.
Select the field from the input dataset.
Select an operator. Depending on the field type, the available operators may vary.
Click Confirm.
Repeat the previous instructions to configure the second set of data.
Configure how to display the comparison between the two sets of data using the parameters from the KPI content section:
From the Comparison direction drop-down list, select either Set 1 compared to Set 2 or Set 2 compared to Set 1.
From the Comparison format drop-down list, select either Difference or Ratio percentage.
(optional) In the Unit field, you can enter the unit associated to the indicator. By default, this unit is placed on the right side of the indicator. You can place it on the left by using the swap toggle.
Click Next to continue with the configuration.
Configure the visualization parameters for a ratio KPI
When creating a ratio KPI, you create two sets of data so that you measure the proportion of one within the other.
From the left side pane, select the function to apply and the field to be used in the first set of data.
You can also filter or refine the data :
Under the desired set, click Add a condition.
Select the field from the input dataset.
Select an operator. Depending on the field type, the available operators may vary.
Click Confirm.
Repeat the previous instructions to configure the second set of data.
Choose how to compute the ratio using the parameters from the KPI content section:
From the Ratio direction drop-down list, select either Set 1 on Set 2 or Set 2 on Set 1.
(optional) In the Unit field, you can enter the unit associated to the indicator. By default, this unit is placed on the right side of the indicator. You can place it on the left by using the swap toggle.
Click Next to continue with the configuration.
Step 5: Configure the visualization styles
Studio includes several predefined layouts for KPIs to display the appropriate data. These layouts help you control how the KPI appears on the page to make it easier to understand.
Some KPI colors are inherited from portal theme colors configured in the back office:
KPI element | Portal theme element |
KPI title | Titles |
KPI context | Text |
Block borders | Boxes border |
For more information about configuring portal theme colors, see Colors.
The block background is white and cannot be configured.
To configure the visualization styles:
Select a layout.
Depending on the selected layout, you can add elements to your KPI: a context, a title, or an image. You can either add an image previously uploaded into the plaform, or a public image from the Internet. a. To use an image from your domain, copy its URL from the back office Assets page to the Image asset URL field. b. To use an image that is not on your domain, paste its URL to the Image asset URL field.
Click Finish.
You can see a summary of the block configuration parameters in the side pane.
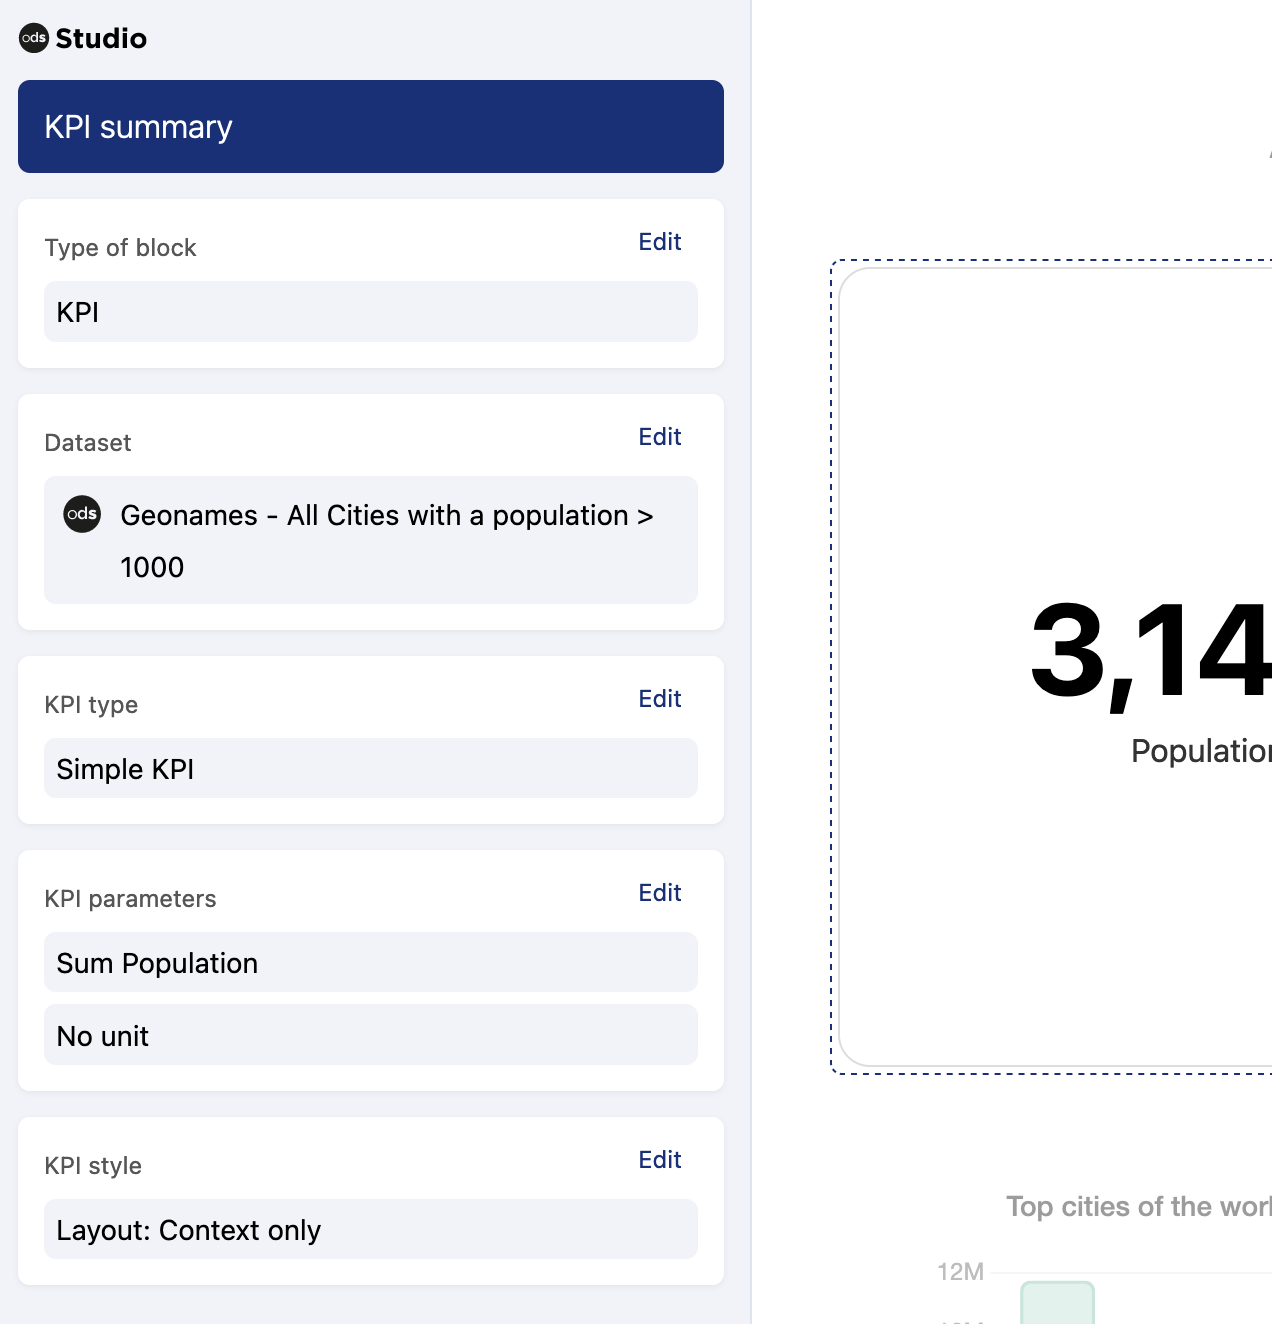
Check the block configuration and click Save.
Your KPI appears in the preview pane.
Once you completed the block configuration, you can click the block again in the preview pane to check and edit the KPI parameters in the side pane.