
Configuring the tooltip
In order to display information on a map, on an image, or in a calendar, you can configure a tooltip. You can use and configure the standard tooltip or customize it more precisely using a custom HTML tooltip. A custom tooltip is slightly more time consuming, but it is a good way to leverage your data. To switch from the standard tooltip configuration interface to this custom tooltip view, select "Custom HTML template" from the tooltip type dropdown menu.
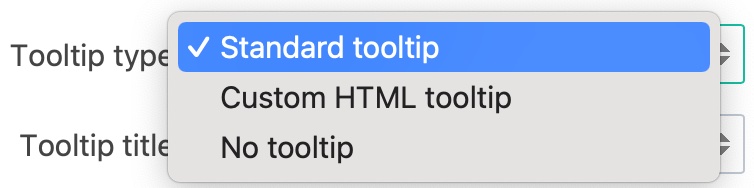
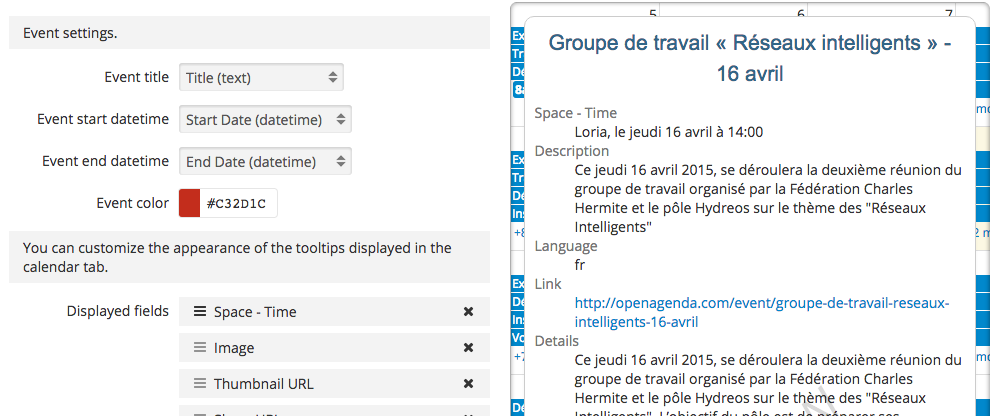
Standard tooltip
You can configure which fields will appear in the tooltip and their relative order. A live preview is available on the right side.
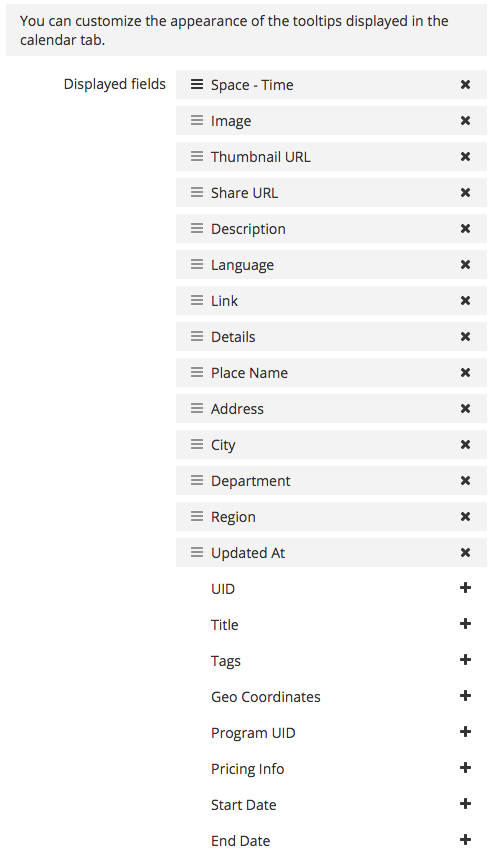
For each of the tooltip's fields, the three following actions are available :

Drag and drop to move a field within the tooltip
Click to remove a field from the tooltip
Click to add a field to the tooltip
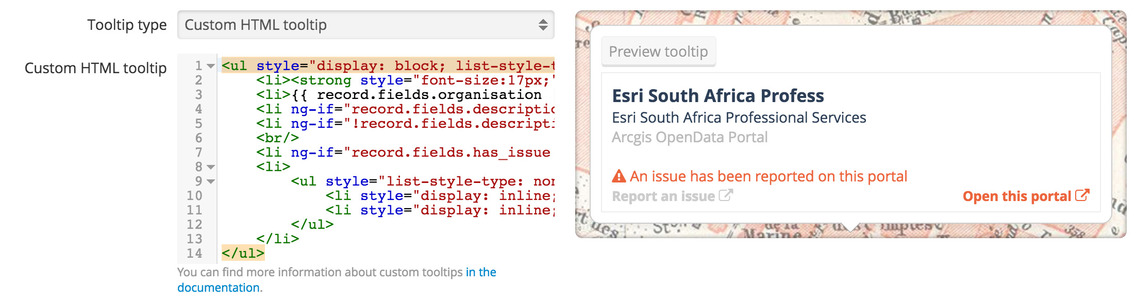
Custom HTML tooltip
When you select , an HTML editor appears. This is very similar to writing "pages" in your domain; you have access to every ODS Widget, and you can even integrate other visualizations inside the tooltip.
When the tooltip is displayed, it can access a specific record variable that is "injected" in the tooltip. This record object contains the following properties:
record.fields: object containing all the values (e.g.record.fields.tree_height)record.recordid: unique identifier for the recordrecord.datasetid: identifier of the dataset
Using these properties, you can directly display values in the tooltip or even use them to display data from other datasets.
The schema of the dataset is also injected as a fields variable, which is an array of field objects (you can use ng-repeat to loop over the fields). A field object contains the following properties:
field.name: the identifier of the field, for example, to find a value withinrecord.fieldsfield.type: the type of the field (text,decimal,integer,date,datetime,geo_point_2d,geo_shape)field.label: a human-friendly label
Here is the code from the example above:
<ul style="display: block; list-style-type: none; color: #2c3f56; padding:0; margin:0;">
<li><strong style="font-size:17px;">{{ record.fields.name | limitTo:25 }}</strong></li>
<li>{{ record.fields.organisation | limitTo:40}}</li>
<li ng-if="record.fields.description" style="color:#bbb;">{{ record.fields.description | limitTo:140 }}</li>
<li ng-if="!record.fields.description" style="font-style:italic;color:#bbb;">No description provided<br/></li>
<br/>
<li ng-if="record.fields.has_issue == 'TRUE'" style="color:#ec643c;"><i class="fa fa-exclamation-triangle"></i> An issue has been reported on this portal</li>
<li>
<ul style="list-style-type: none; color: #2c3f56;padding:0 0 15px;margin-top:0px;">
<li style="display: inline;float:left;"><strong style="font-size:13px;"><a ng-href="https://docs.google.com/forms/ d/1-9m30rCw492oGCB7Pg3aOsZ-q03KBeJsw_GZFLqIvNE/ viewform?entry.1740897944={{record.fields.name}}&entry.1624486384={{record.fields.url}}&entry.462034829&entry.848235220" style="color:#ccc;" target="_blank">Report an issue </a></strong><i class="fa fa-external-link" style="color:#ccc;"></i></li>
<li style="display: inline;float:right;"><strong style="font-size:13px;"><a ng-href="{{record.fields.url}}" style="color:#ec643c;" target="_blank">Open this portal </a></strong><i class="fa fa-external-link" style="color:#ec643c;"></i></li>
</ul>
</li>
</ul>
If you want to display an image from one of your dataset's file fields, you can use the ods-record-image widget.
You can use a <ods-dataset-context> to display a visualization from another dataset; in the following example, the data is taken from another dataset and filtered using one of the values of the selected record
<div class="my-tooltip">
<h1>City report : {{ record.fields.city_name }}</h1>
<ods-record-image field="city_logo" record="record"></ods-record-image>
 <!-- Create a context reading data from another dataset but filtered on

         the city that the user clicked on -->

    <ods-dataset-context context="alerts"

                         alerts-dataset="city-alerts-realtime"

                         alerts-parameters="{'refine.city': city_name}">

        <ods-table context="alerts"></ods-table>

    </ods-dataset-context>

</div>
No tooltip
You can choose not to display any tooltip. This can be useful, for example, when you want to display several layers on a map and to have only one layer with tooltips.