
Analyzing data usage
Users must have the "Browse analytics" permission to consult the Analytics dashboards.
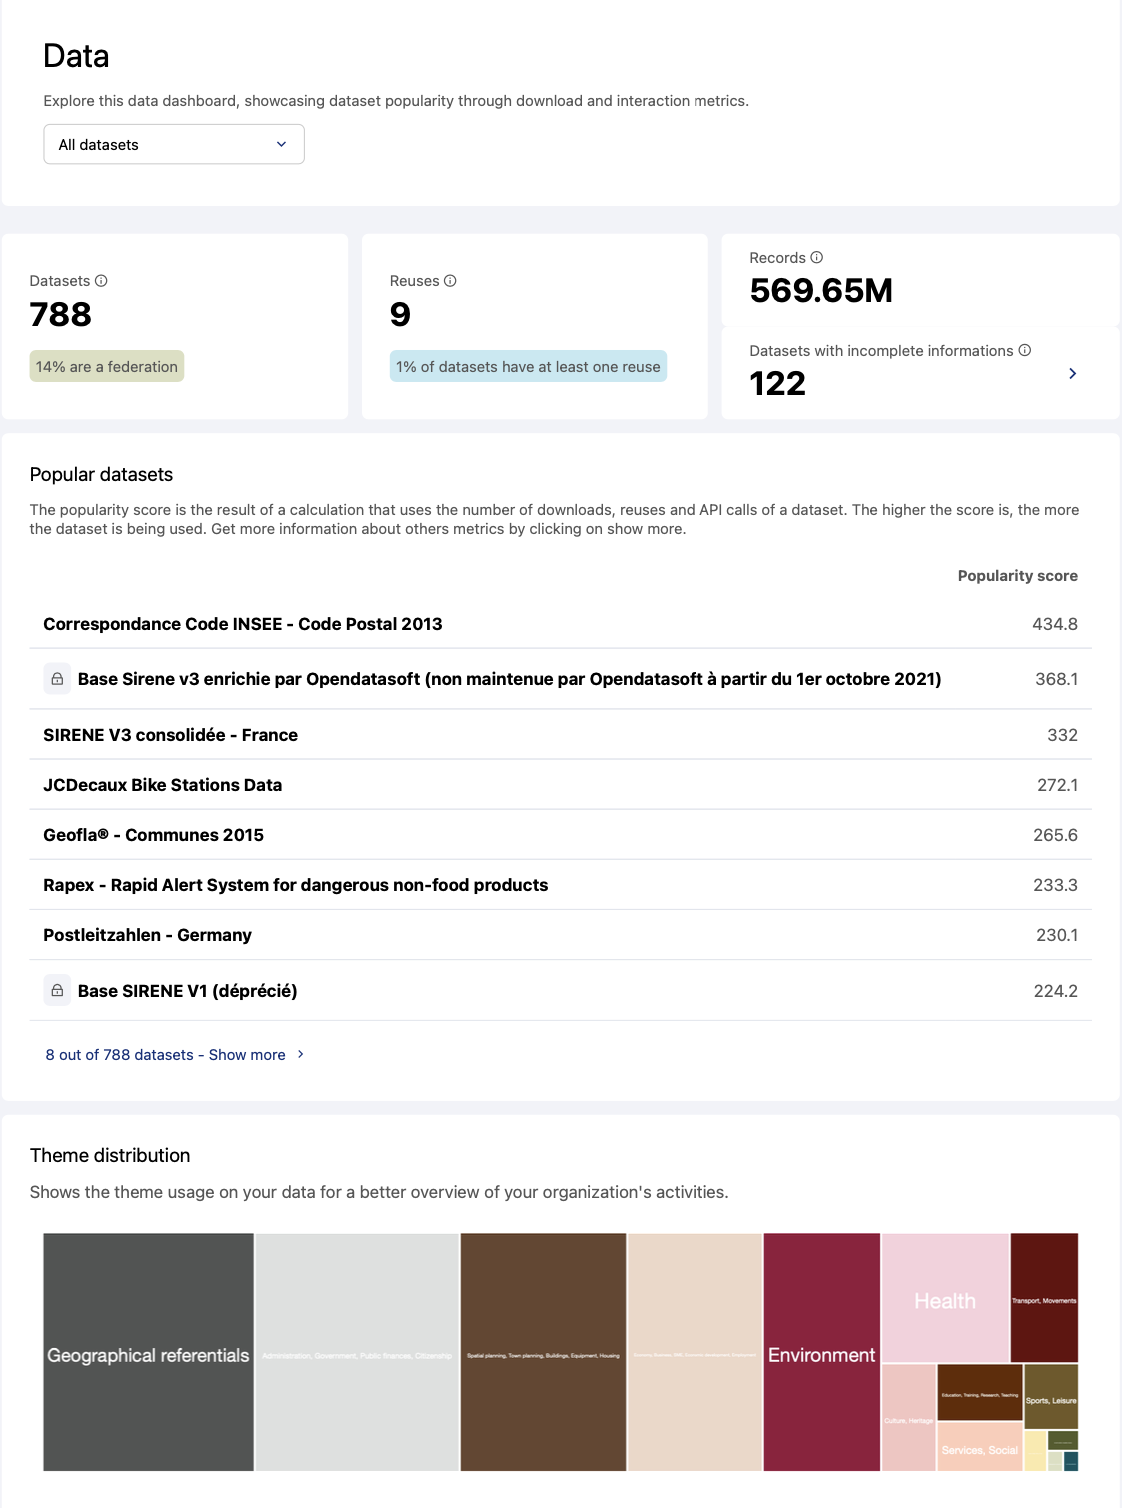
The Data dashboard presents dataset popularity through download and interaction metrics.
To see it, go to Analytics > Data.
In this dashboard, we take into account only published datasets. Any datasets that have not been published are not included in the figures, charts, or other computed analytics that are displayed here.
Filtering the data
You can filter the data based on dataset access conditions.
There is no time limit. The counters indicate the cumulative figures since the first publication of the dataset.
Key indicators
Datasets: the current total number of published datasets, including the percentage of federated datasets.
Downloads: This is the total number of download of your published datasets.
APIs calls: This is the total number of api calls of your published datasets.
Reuses: This refers to the current reuses of published datasets, including the percentage of datasets that are linked to at least one reuse. For example, if you have 10 published datasets and 1 of them has four reuses, the percentage would be 10%.
KPI Reuses is available if the option "Allow reuses" is enabled on the workspace. If not, additional information about the following KPIs will be displayed.
Records: This is the total number of records of your datasets (federated dataset are excluded).
Additional information if the KPI reuse is not displayed: the portion of datasets that represent at least 50% of the total number of records.Datasets with incomplete information: This is the total number of datasets with at least one unfilled metadata field among the following fields: publisher, theme, or license.
Additional information if the KPI reuse is not displayed: the percentage of published datasets with missing information. You can view the list of datasets by clicking on the link.Popular datasets: The popularity score is the result of a calculation that uses a dataset's number of downloads, reuses, and API calls. The higher the score is, the more the dataset is being used. You can sort these datasets by cumulative number of downloads, API calls, or reuses by clicking on Show more.
Theme distribution: This section of the Data dashboard displays a tree chart representing all currently used dataset themes. This chart helps you analyze which themes are the most or the least used.
Hover over a theme in the tree chart to display the number of the datasets which belong to that theme.
The underlying data
To view the complete dataset, just scroll down to the bottom of the dashboard and click on See source data.
This dataset is based on the following API fields:
Field name | Field description |
dataset_id | The dataset's identifier |
title | The dataset's title |
domain_id | The identifier of the workspace to which the dataset belongs |
modified | The date the dataset was last modified |
publisher | The dataset's publisher's name |
license | The type of license |
keyword | A list of the keywords attached to the dataset |
theme | The name of the dataset's theme |
Reuse count | The number of reuses |
API call count | The total cumulative number of API calls |
Download count | The total cumulative number of downloads |
Attachments download count | The total cumulative number of times an attachment was downloaded from the dataset |
File fields download count | The total cumulative number of times files (stored in a field) were downloaded |
Popularity score | This computation is based on three metrics: number of downloads, number of API calls, and number of reuses |
records_count | The total number of records in the dataset |
records_size | The size of the dataset (in Bytes) |
security | List of users with access (if rules have been configured) |
visibility | The dataset's access conditions |
federated | The source if the dataset is a federation |