
Configuring the images visualization
For the Images tab to be visible, the dataset must contain at least one file field, containing at least one image or any other file type that can generate a thumbnail: .gif, .png, .jpeg, .jpg, .tif, .tiff, and .bmp.
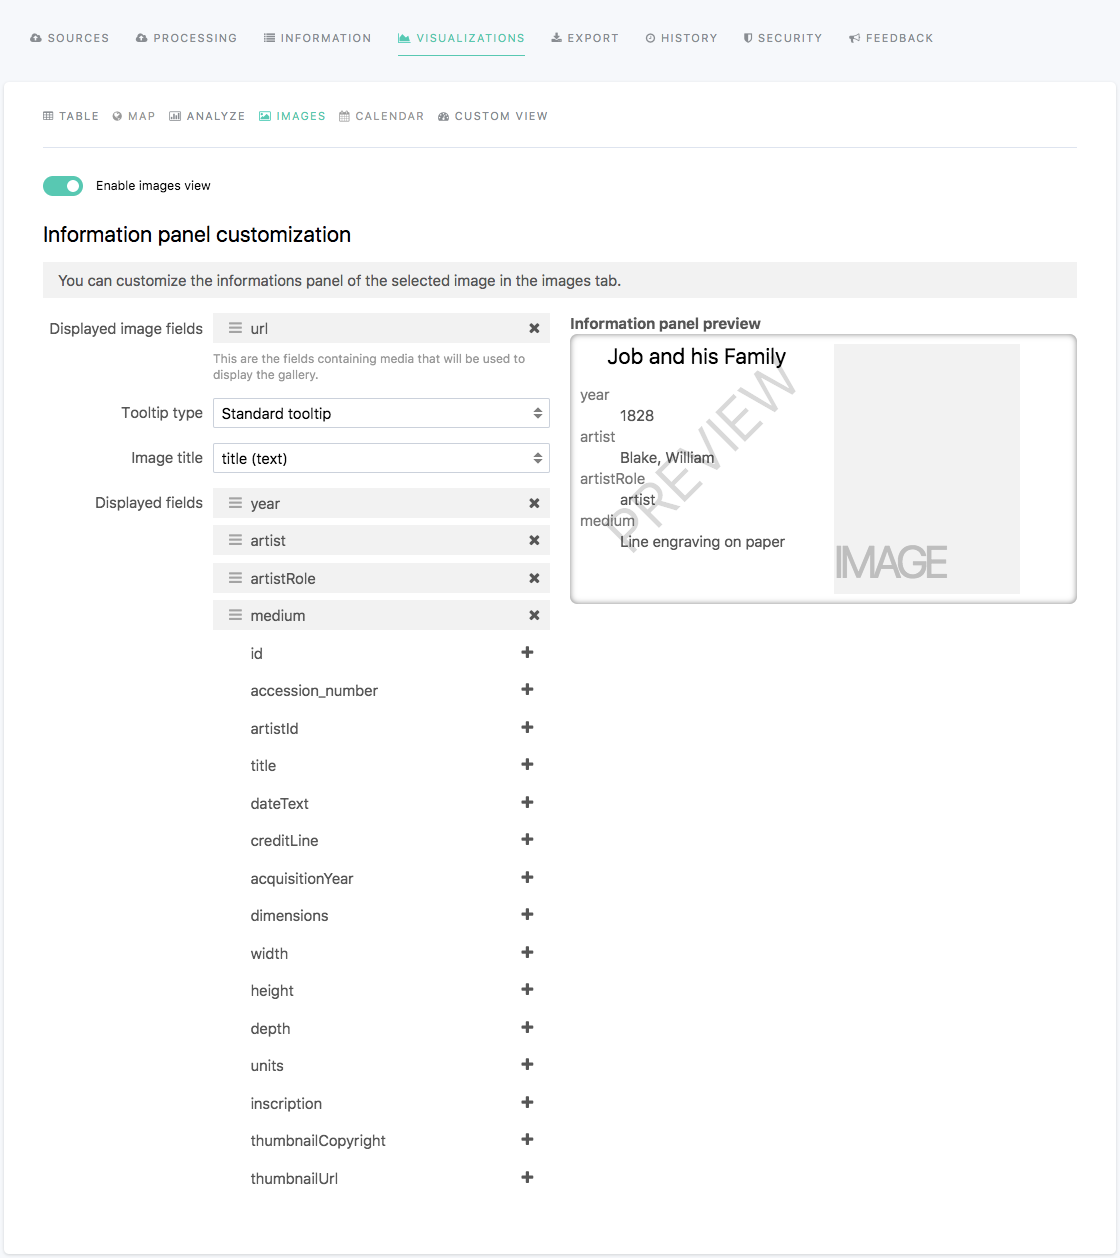
When editing a dataset, the Visualizations > Images tab allows to configure the image gallery of the images visualization displayed in the portal once the dataset is published.
The images visualization, when available, is optional. It can be enabled or disabled using the tick box displayed right under the visualizations tabs.
Customizing the information panel
To configure the information panel of the Images visualization, follow the indications from the tables below.
Option name | Description | Usage |
Displayed image fields | Fields that contain images and that will be displayed in the Images visualization. In the list, the fields with a gray background are those that will be displayed, whereas those without a colored background will be hidden. Only the file type fields are available in this option. | To add an image field in the images visualization:
To hide an image field from the Images visualization:
|
Tooltip types | Two tooltip types:
|
|
Standard tooltip options
Option name | Description | Usage |
Image title | Title of the image, used as a tooltip title. |
|
Displayed fields | Fields from the dataset which values will be displayed in the tooltip. In the list, the fields with a gray background are those that will be displayed in the tooltip, whereas those without a colored background will be hidden from the tooltip. | To add a field in the tooltip:
To hide a field from the tooltip:
To reorder the fields:
|
Custom HTML tooltip options
Option name | Description | Usage |
Custom HTML tooltip | HTML area to write the content of the tooltip. Three buttons above the text area allow you to reindent a selection, reindent the whole HTML text, or to wrap the lines. | Write the content of the tooltip in HTML. |
For more information about tooltips and how to configure both Standard and Custom HTML tooltips, see Configure the tooltip documentation.