Using filters to enhance your pages
When creating a Studio page, and more generally a data visualization page, you can often use filters to make your visualizations more dynamic.
Adding filters in a page allows your visitors to refine the displayed data, and can transform a static data page into a powerful data story.
There are two basic steps to use filters, plus a choice:
Create a filters section
Add filters
Use a value list filter
Use a date filter
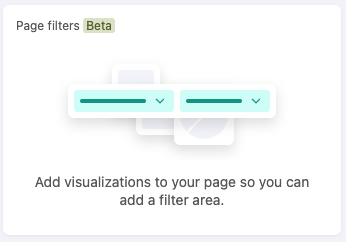
Note that filters can only be added when there is at least one data visualization already configured on your page.
1. Create a filters section
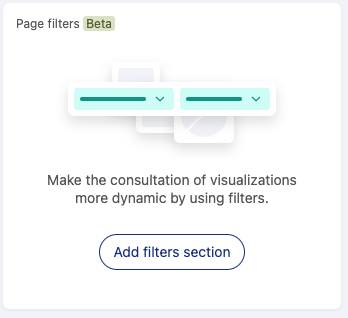
Once you have added at least one visualization to your page, the filters editor will show up in the left column. There you can add a filters section on the page by clicking on Add filters section.
A new section will be created on the top of your page.
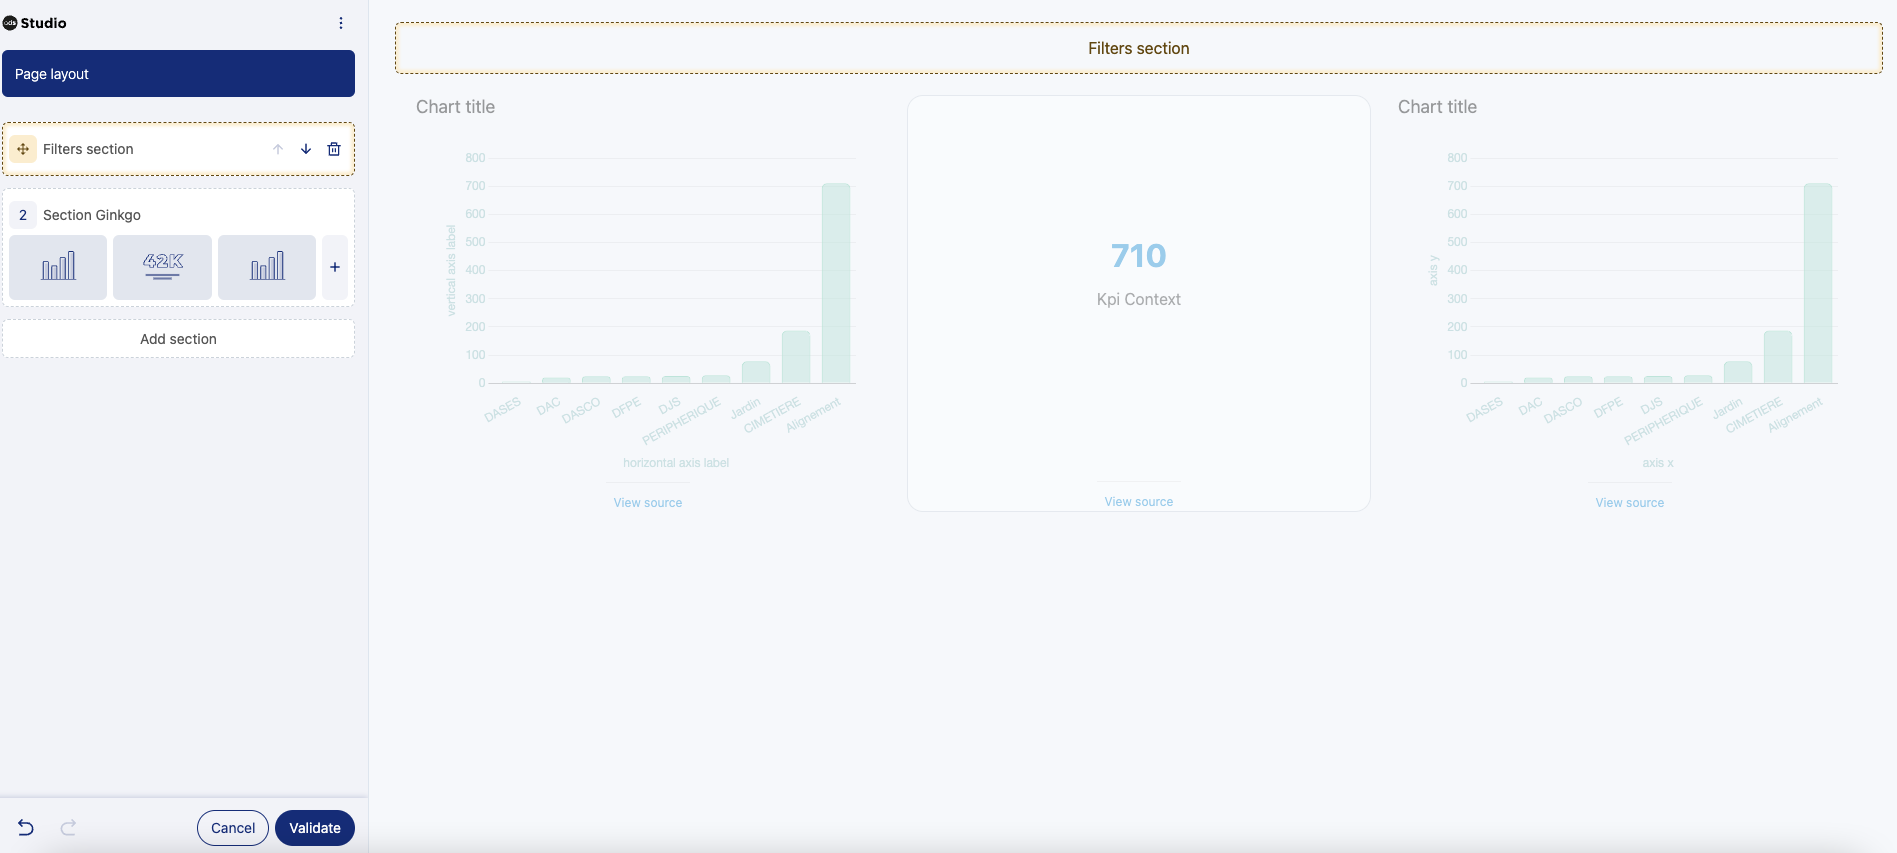
You can reposition the section by dragging and dropping it, or else using the up/down arrows in the page layout interface. But remember, filters apply to all visualizations, and don't depend on the placement of the filters section.
After clicking the Validate button at the bottom of the screen, the filters sections is ready and set in your page.
2. Add filters
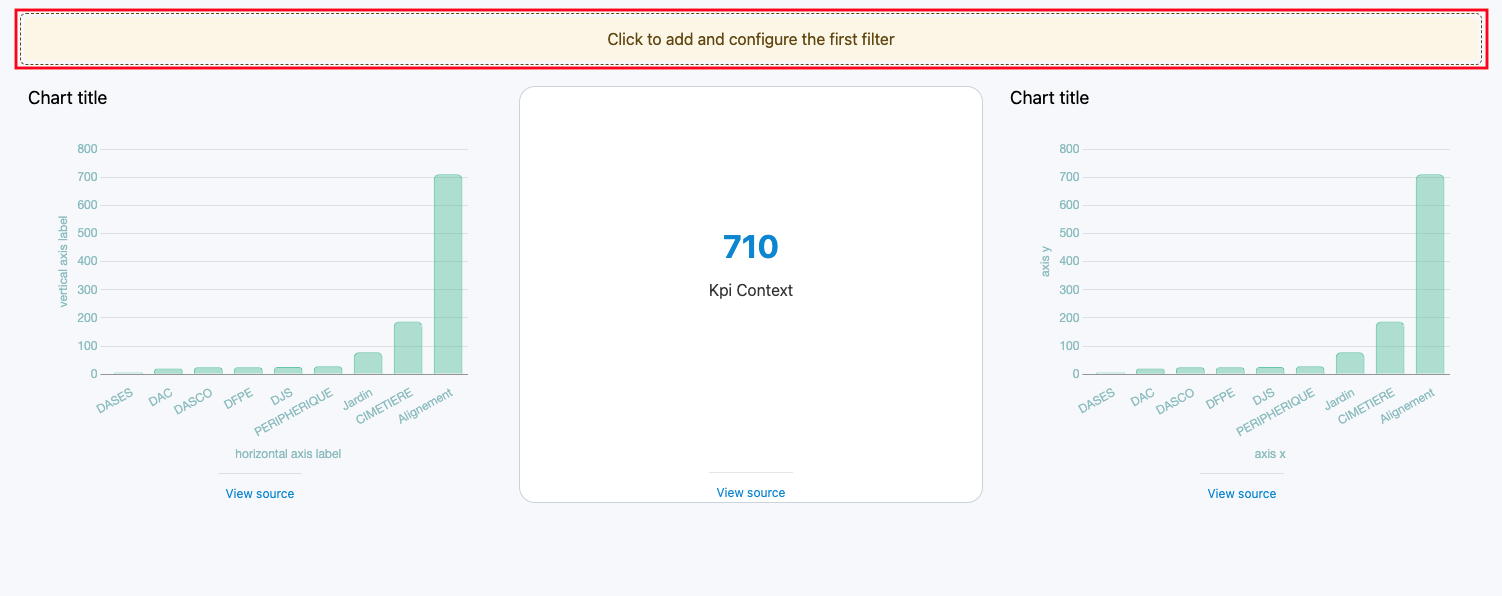
To add a filter, you will need to click directly on the filters section displayed in the page preview on the right.
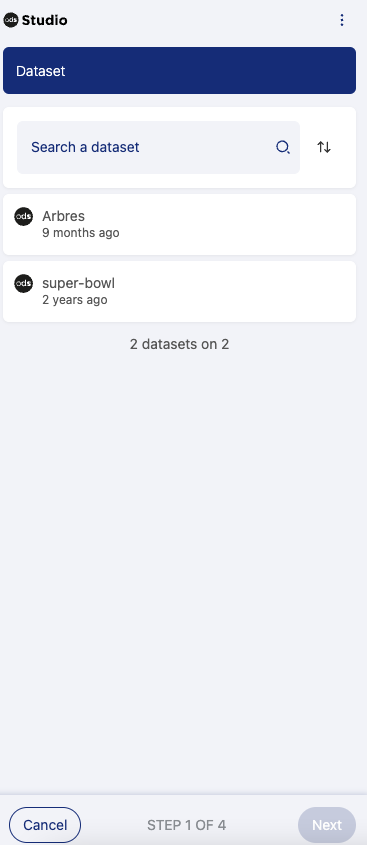
In the filter editor on the left side of your screen, choose the dataset on which the new filter will apply (remember that only datasets you've already used in a visualization will be available).
After choosing the right dataset and clicking Next, two different filters will be available: one based on a value list and the second based on date values or ranges.
Depending on the dataset that was chosen previously, some filters won't be available if no corresponding field type is available in the dataset. For example, the date filter is unavailable since the dataset doesn't contain a date field type.
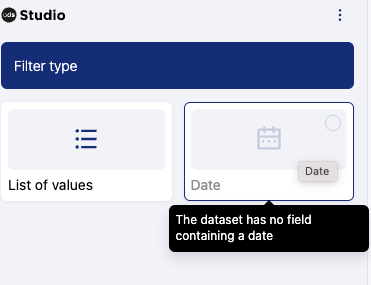
Select which filter type you wish to use and click Next.
Note that filters refine the data for a target dataset. If you apply multiple filters to the same dataset, each of those filters will have an impact on the values available in the others.
a. Set a value list filter
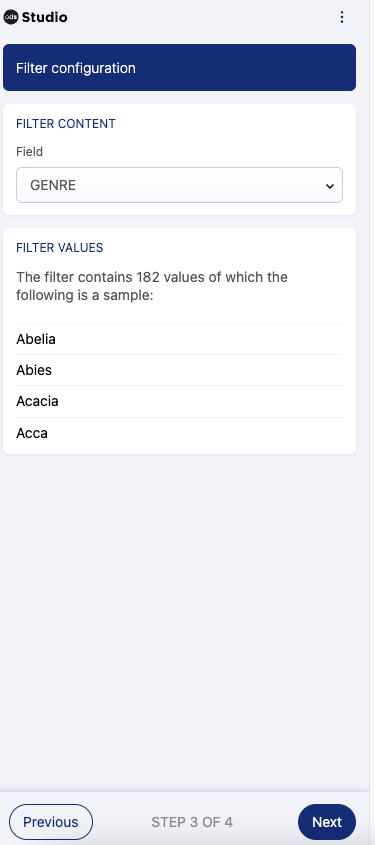
If you select the value list filter, you first must choose the field that contains the value you want to use to filter your data:
Here we will use the field "GENRE." After selecting it, a preview of some of the values will be displayed to make sure that this field will be the proper filter for your page:
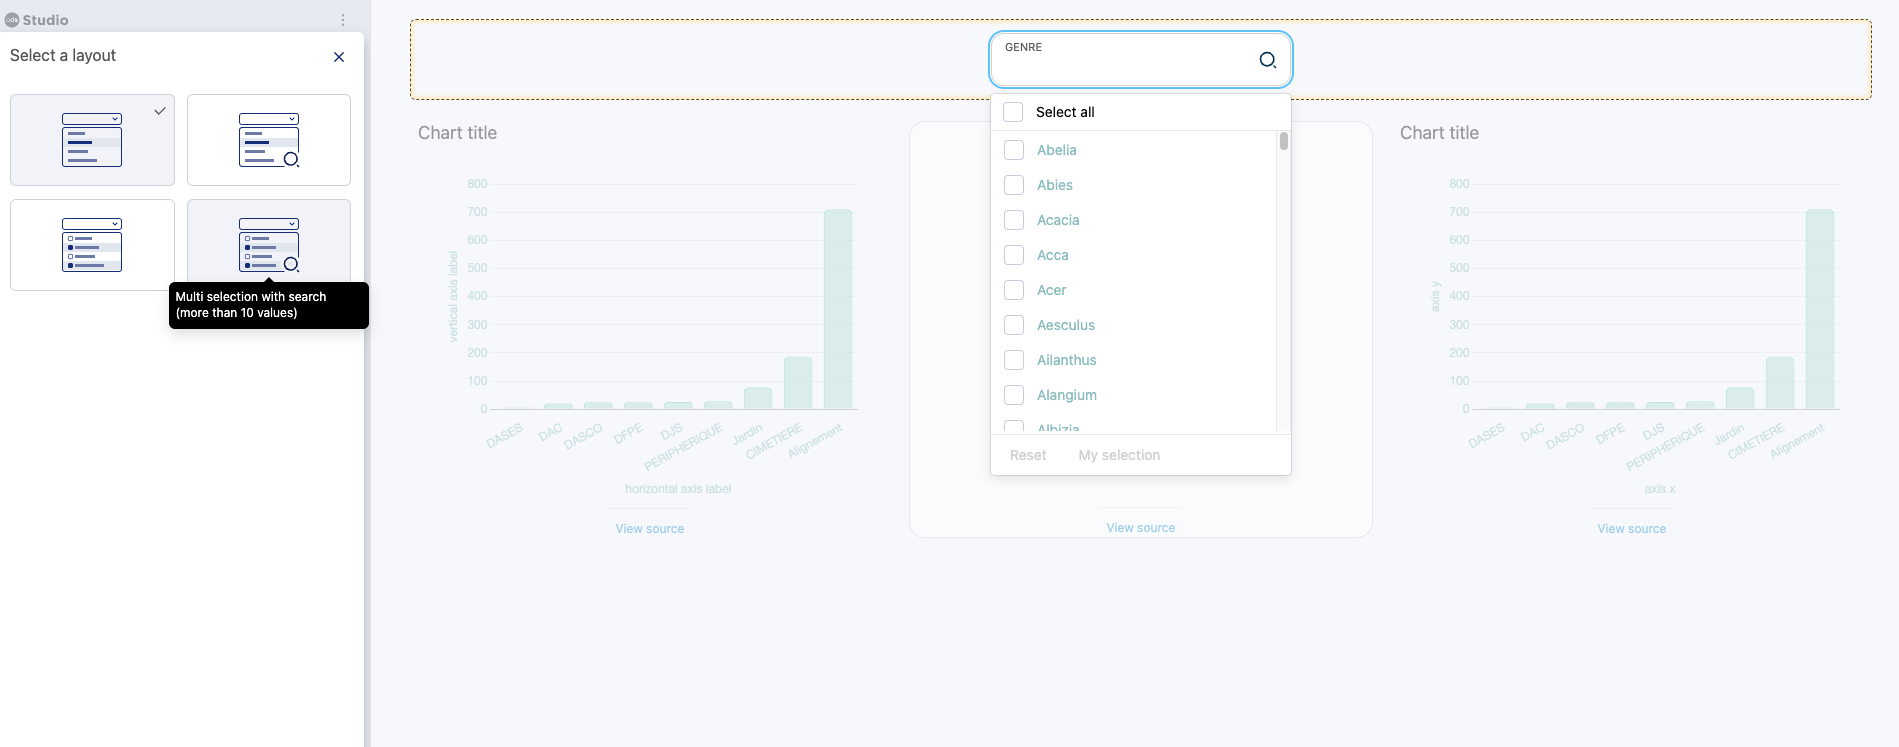
In the final step of the value list filter configuration you will be able to choose among four types of layouts:
Single value: The page visitor will be able to choose only one value from the selected input. This is a simple filter, perfect for when the list of possible values is short.
Single value and search: The page visitor will be able to choose only one value to refine the data, but can search for a specific value inside the filter without having to scroll through the whole list. This option is particularly useful when the list is long and makes it hard to find the proper data.
Multiple values: This allows the page visitor to choose multiple values.
Multiple values and search: This enables the page visitor to select more than one value, but also to search for specific values.
The layout of the filter menu will adapt for the selected usage. A preview will be displayed on the right side to help you make the right choice.
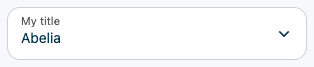
After choosing the layout, you can add an optional title for the filter, and choose values to select by default. (Default values are optional, and naturally the user can un-select them if they wish.)
Alternatively, if you want to permanently filter your data, you should add these conditions directly to the data configuration within each visualization.
As an example, let's imagine we add a title, "My title," and a default value, "Abelia." You can see that on the right side, the filter is pre-filled with the chosen value, and the title appears at the top:
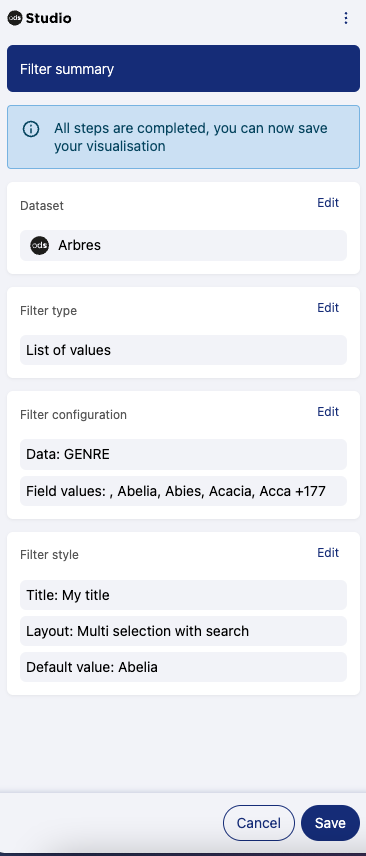
After clicking on the Next button, the configuration is complete, a summary is displayed and you can save your filter:
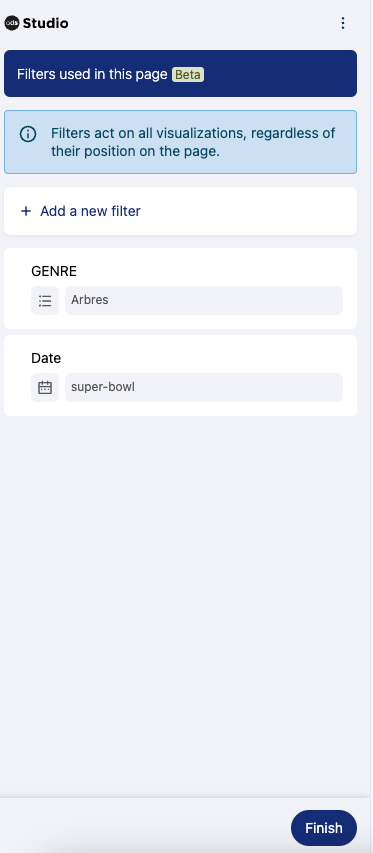
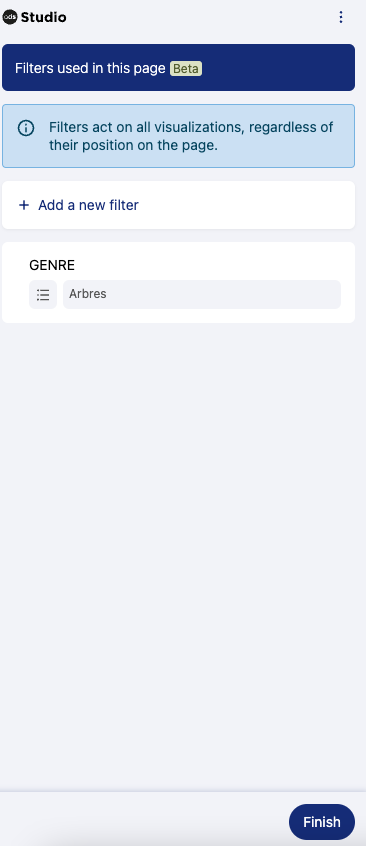
After saving the filter, it will appear in the list of filters in the filters section:
b. Set a date filter
If you select the date filter, you must first choose a dataset, then a type of filter.
You first must choose the field that contains the date value you want to use to filter your data. In the field selector, only the fields containing dates will be available:
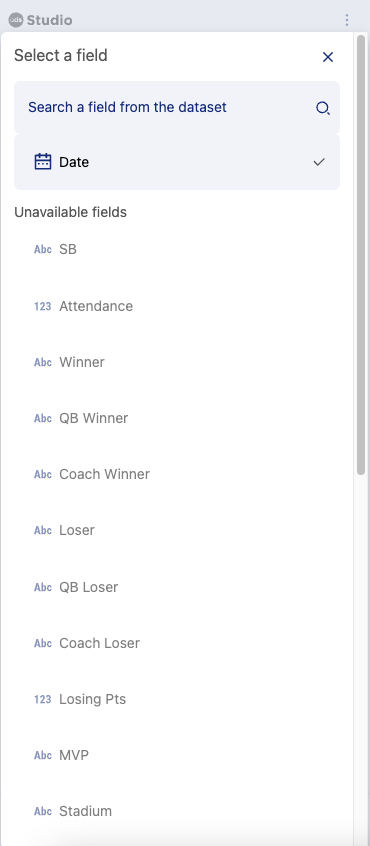
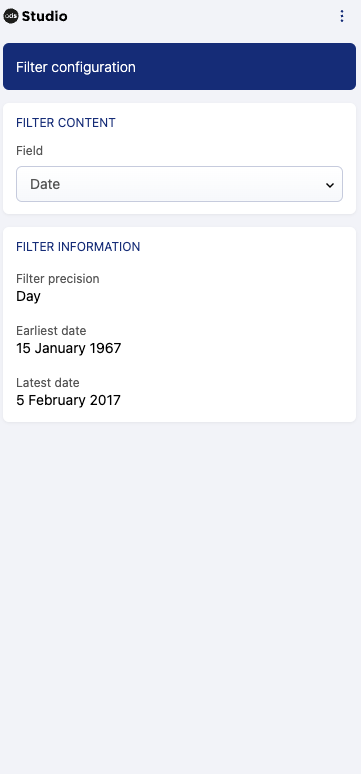
After selecting the right field, information about the precision of the date data (minute/hour/day/week/month/year), as well as the earliest and latest date for that field, will appear so you can make sure that the field is appropriate for your page:
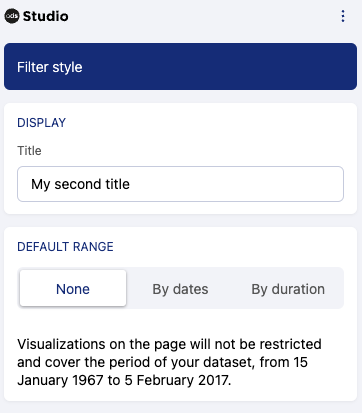
The final step of the date filter configuration enables you to add an optional title and default values. No default values are set automatically, so unless you specify otherwise the displayed data covers the whole date range:
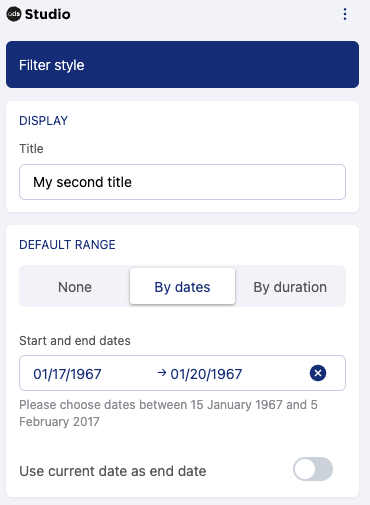
To add default values you will have the choice between setting fixed dates as start and end dates or a sliding range (for example, the past week).
Fixed dates can be set using both start and end dates, or else only a start date without an end date. You can also use today's date as end date by activating the toggle:
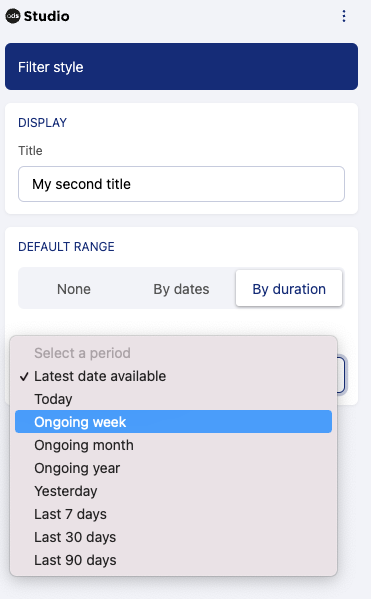
Sliding date ranges allow you to specify generic periods:
So finally, for example after choosing "Last 7 days," the configuration is complete and the summary of the filter configuration is displayed.
Click on Save to finish the configuration. After saving the filter, it will appear in the list of filters in the filters section: