
Configuring the custom view
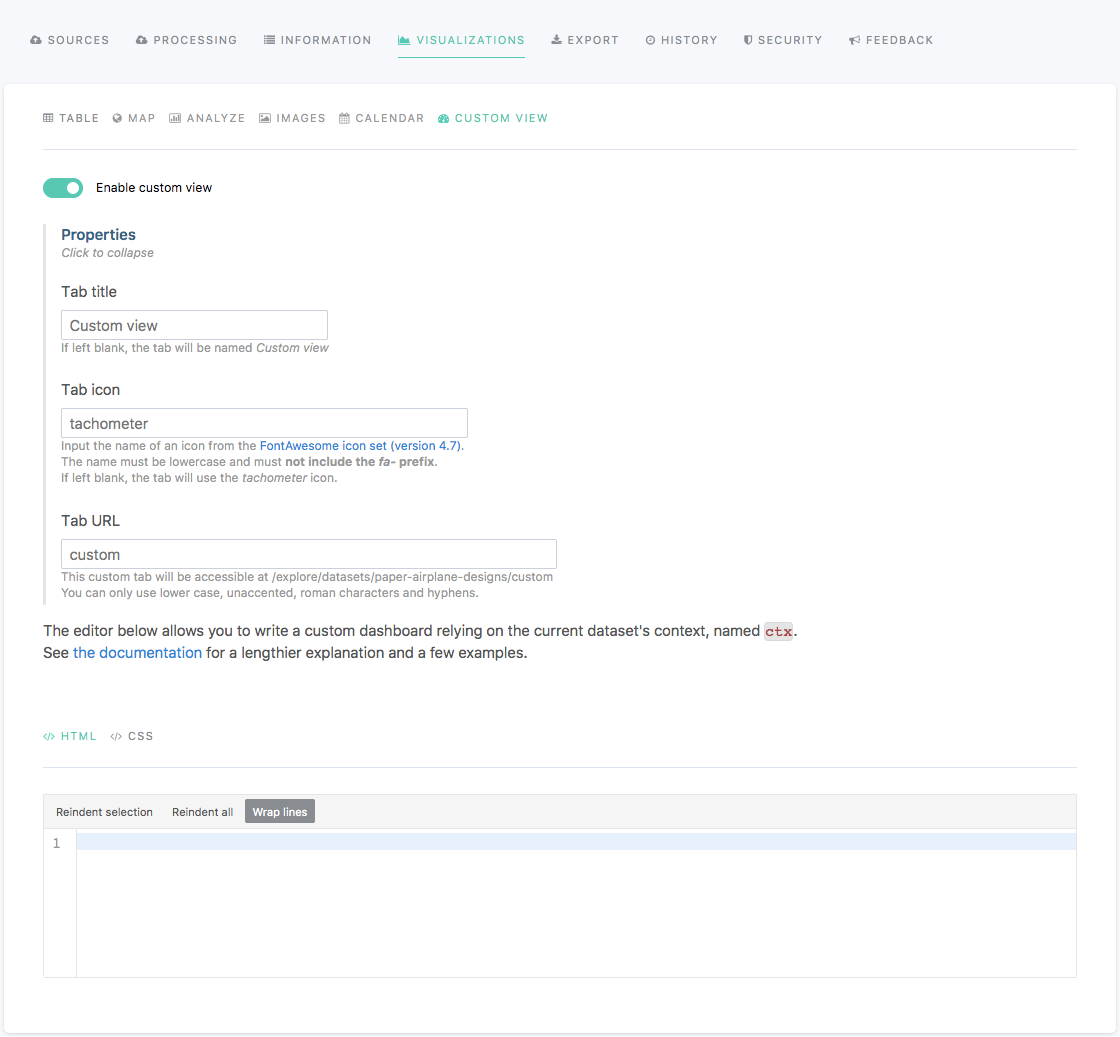
In the edition interface of a dataset, the Visualizations > Custom view tab allows to configure a custom view displayed in the portal once the dataset is published.
In contrary to all other visualizations, the "Custom view" is not a predefined visualization that adapts to a dataset. It is a blank space that can be used for any purpose, as long as it is related to the dataset, and can be filled in with HTML and CSS. It can be seen like a miniature page (see Creating content).
The custom view is available for every dataset but is optional. It can be enabled or disabled using the tick box displayed right under the visualizations tabs.
To set the parameters of the custom view, follow the indications from the table below.
Option name | Description | Usage |
Tab title | Title of the Custom view tab in the front office. If left blank, the tab will be named "Custom view." | Write a title in the "Tab title" textbox. |
Tab icon | Icon of the Custom view tab in the front office. If left blank, the icon of the tab will be the tachometer icon. | Write the name of the Font Awesome icon in the "Tab icon" textbox.
|
Tab URL | URL to access the Custom view tab. By default, the URL to a custom view is: | Write the URL of the custom view in the "Tab URL" textbox. |
Opendatasoft widgets, such as the ones used for bigger visualizations, can be added to a custom view. If necessary, these widgets can interact with elements on the wider webpage—for example, with the dataset filters.For widgets to interact with the rest of the page, use ctx as the ods-dataset-context.Otherwise, define a custom ods-dataset-context for the custom view.