
Configuring the table visualization
For the table visualization to be available, the dataset must contain at least one source.
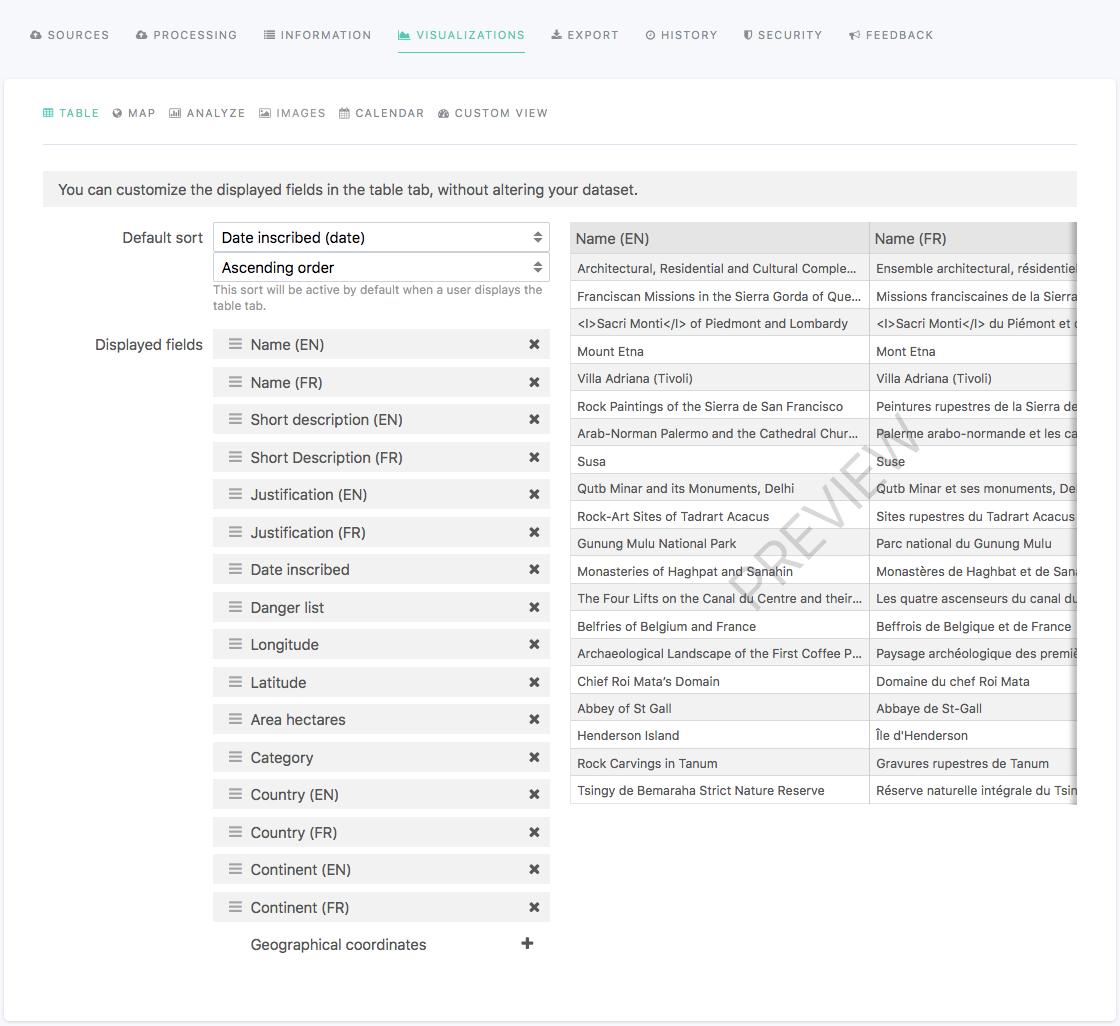
When editing a dataset, the Visualizations > Table tab allows you to configure the table visualization that is displayed in your portal once the dataset is published.
The table visualization cannot be disabled.
To configure the table visualization, follow the indications from the table below.
Option name | Description | Usage |
Default sort | By default, the table visualization keeps the order of the records as it is after they have been processed. It is possible to define another default sort by choosing a field and a sort type. |
|
Displayed fields | By default, the table visualization keeps the order of the fields as it is after they have been processed. It is possible to reorder fields, as well as to hide them.
| To reorder fields, drag and drop to move a field above or below another one. To hide a field from the table visualization, click on the X icon on the right side of each field. |