
Understanding automatic clustering in maps
This article applies to maps made in: Your workspace's Maps tab (.../map), a dataset's Map tab, and the ods-map widget in the Code editor. It does not apply to maps created with Studio.
When you display geographical data on a map, you want the data to be shown efficiently, no matter where you are on the map or at what scale.
To keep things readable and make sure the map is loaded in seconds, even when there's a lot of data, your data can be set to "cluster," or to display in groups according to the scale.
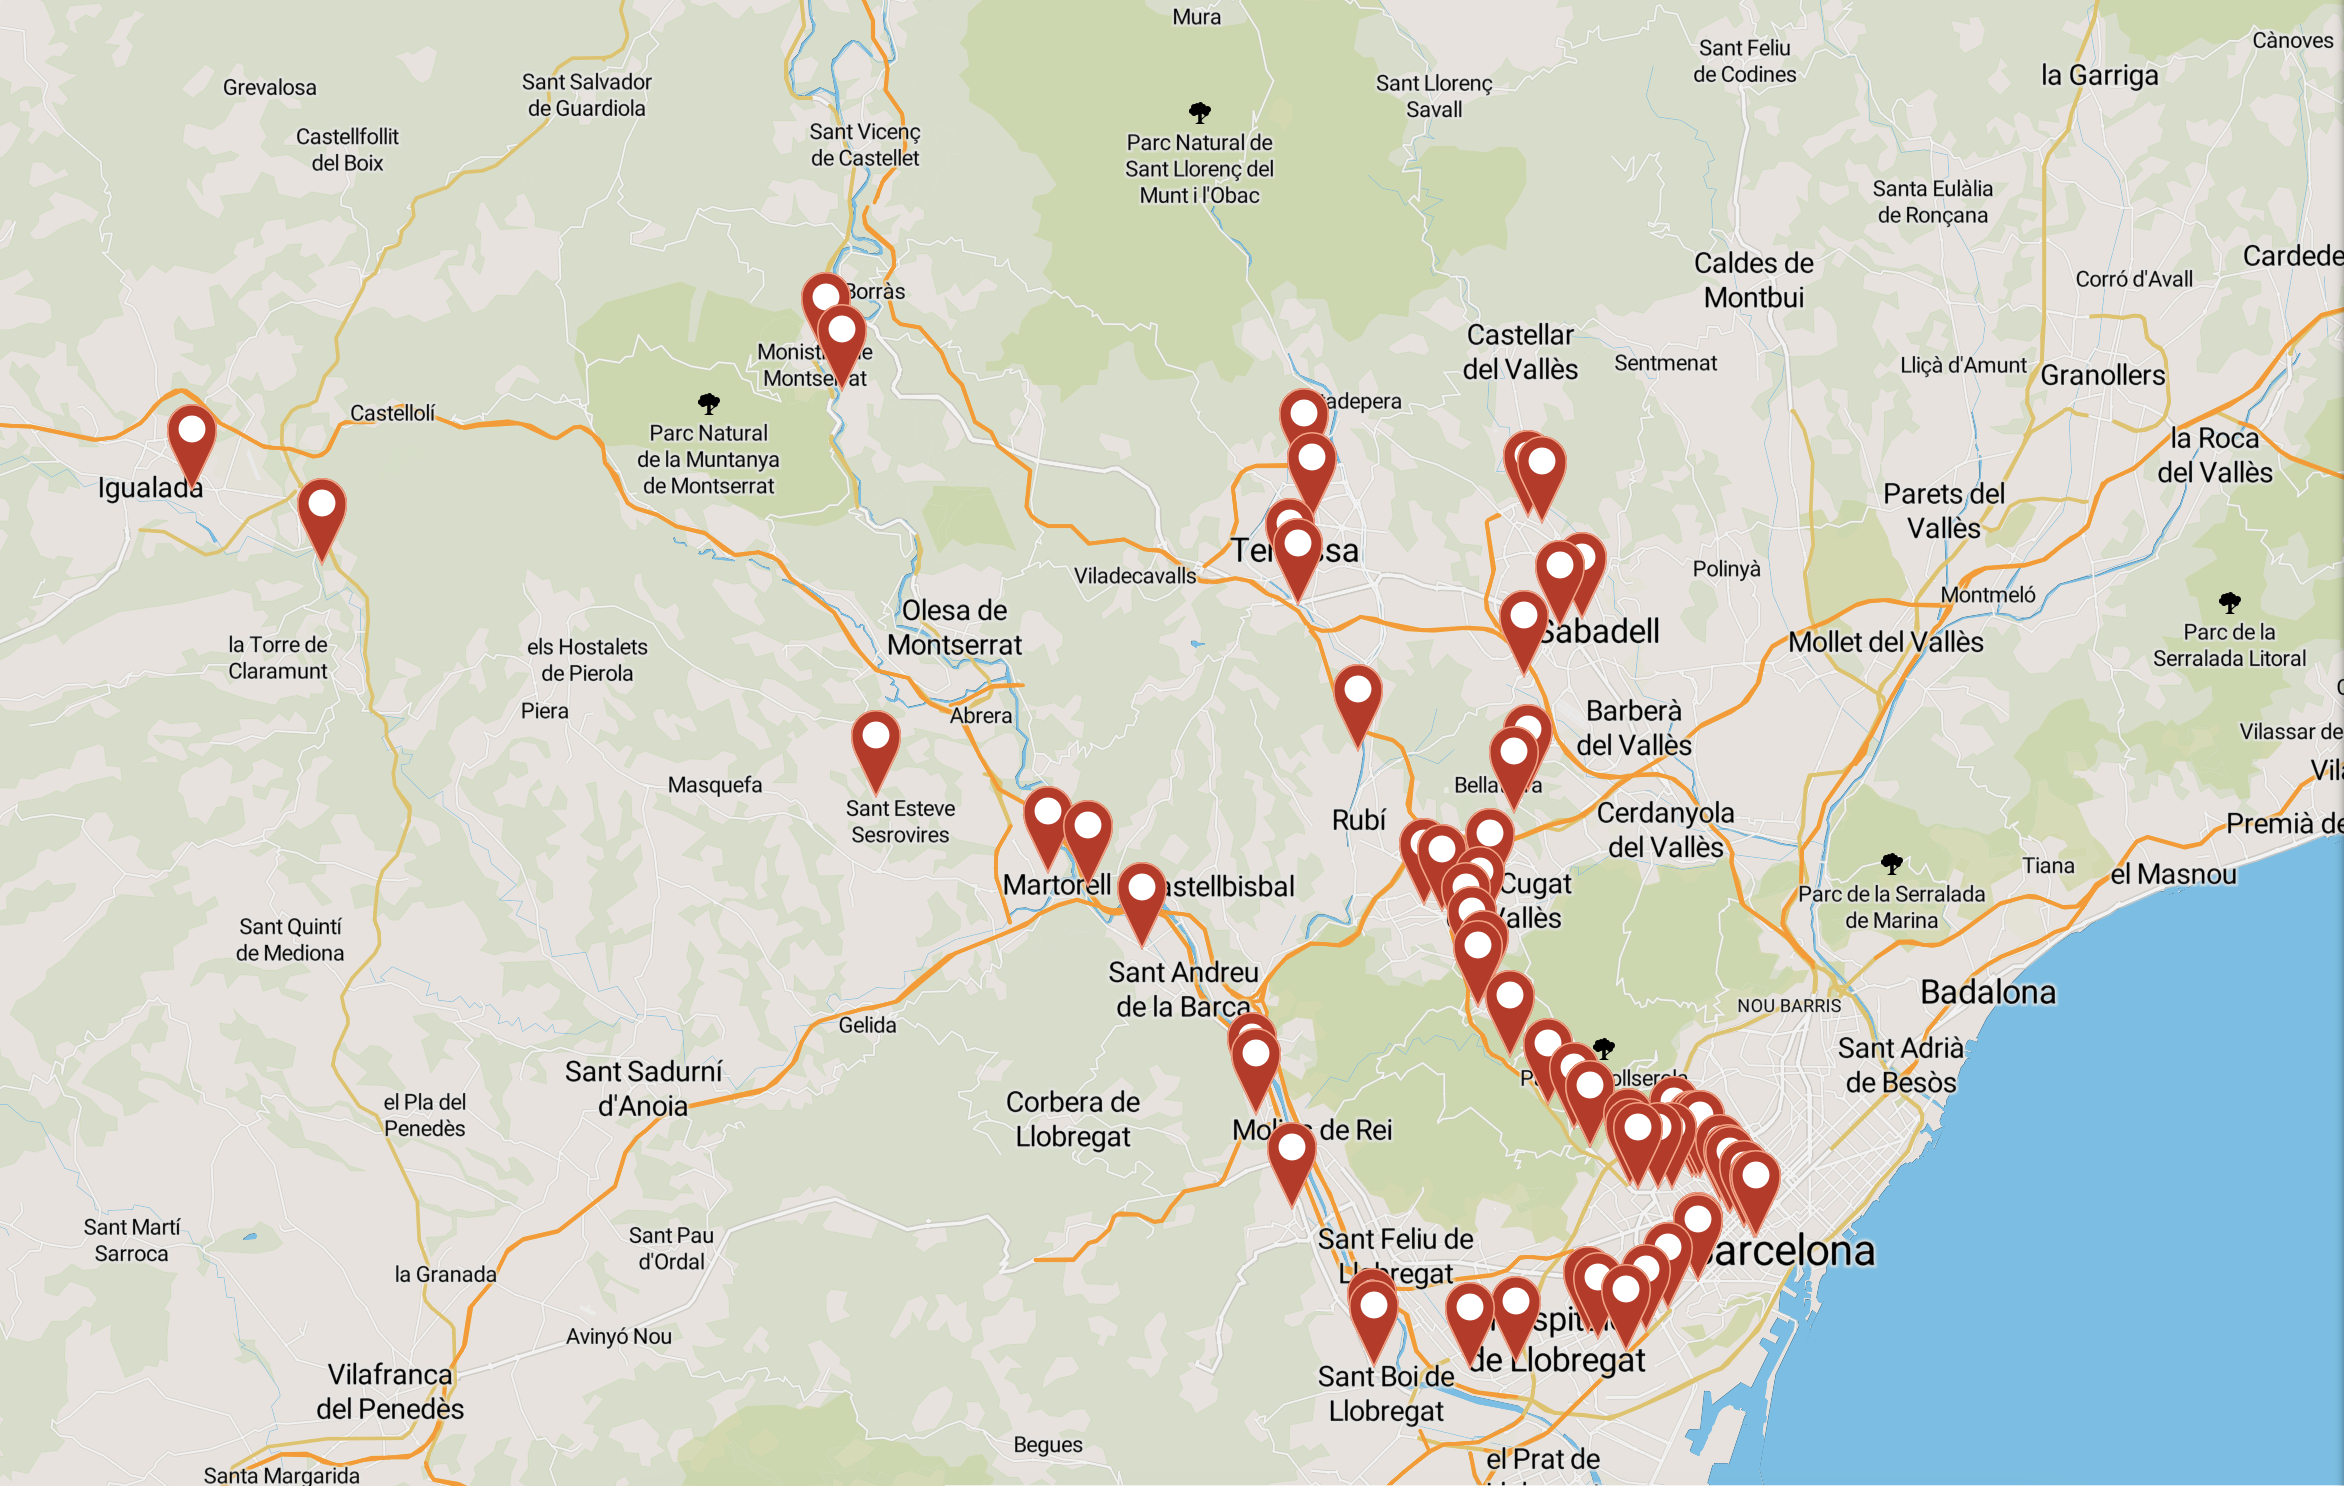
Here is an example of the non-clustered mode :
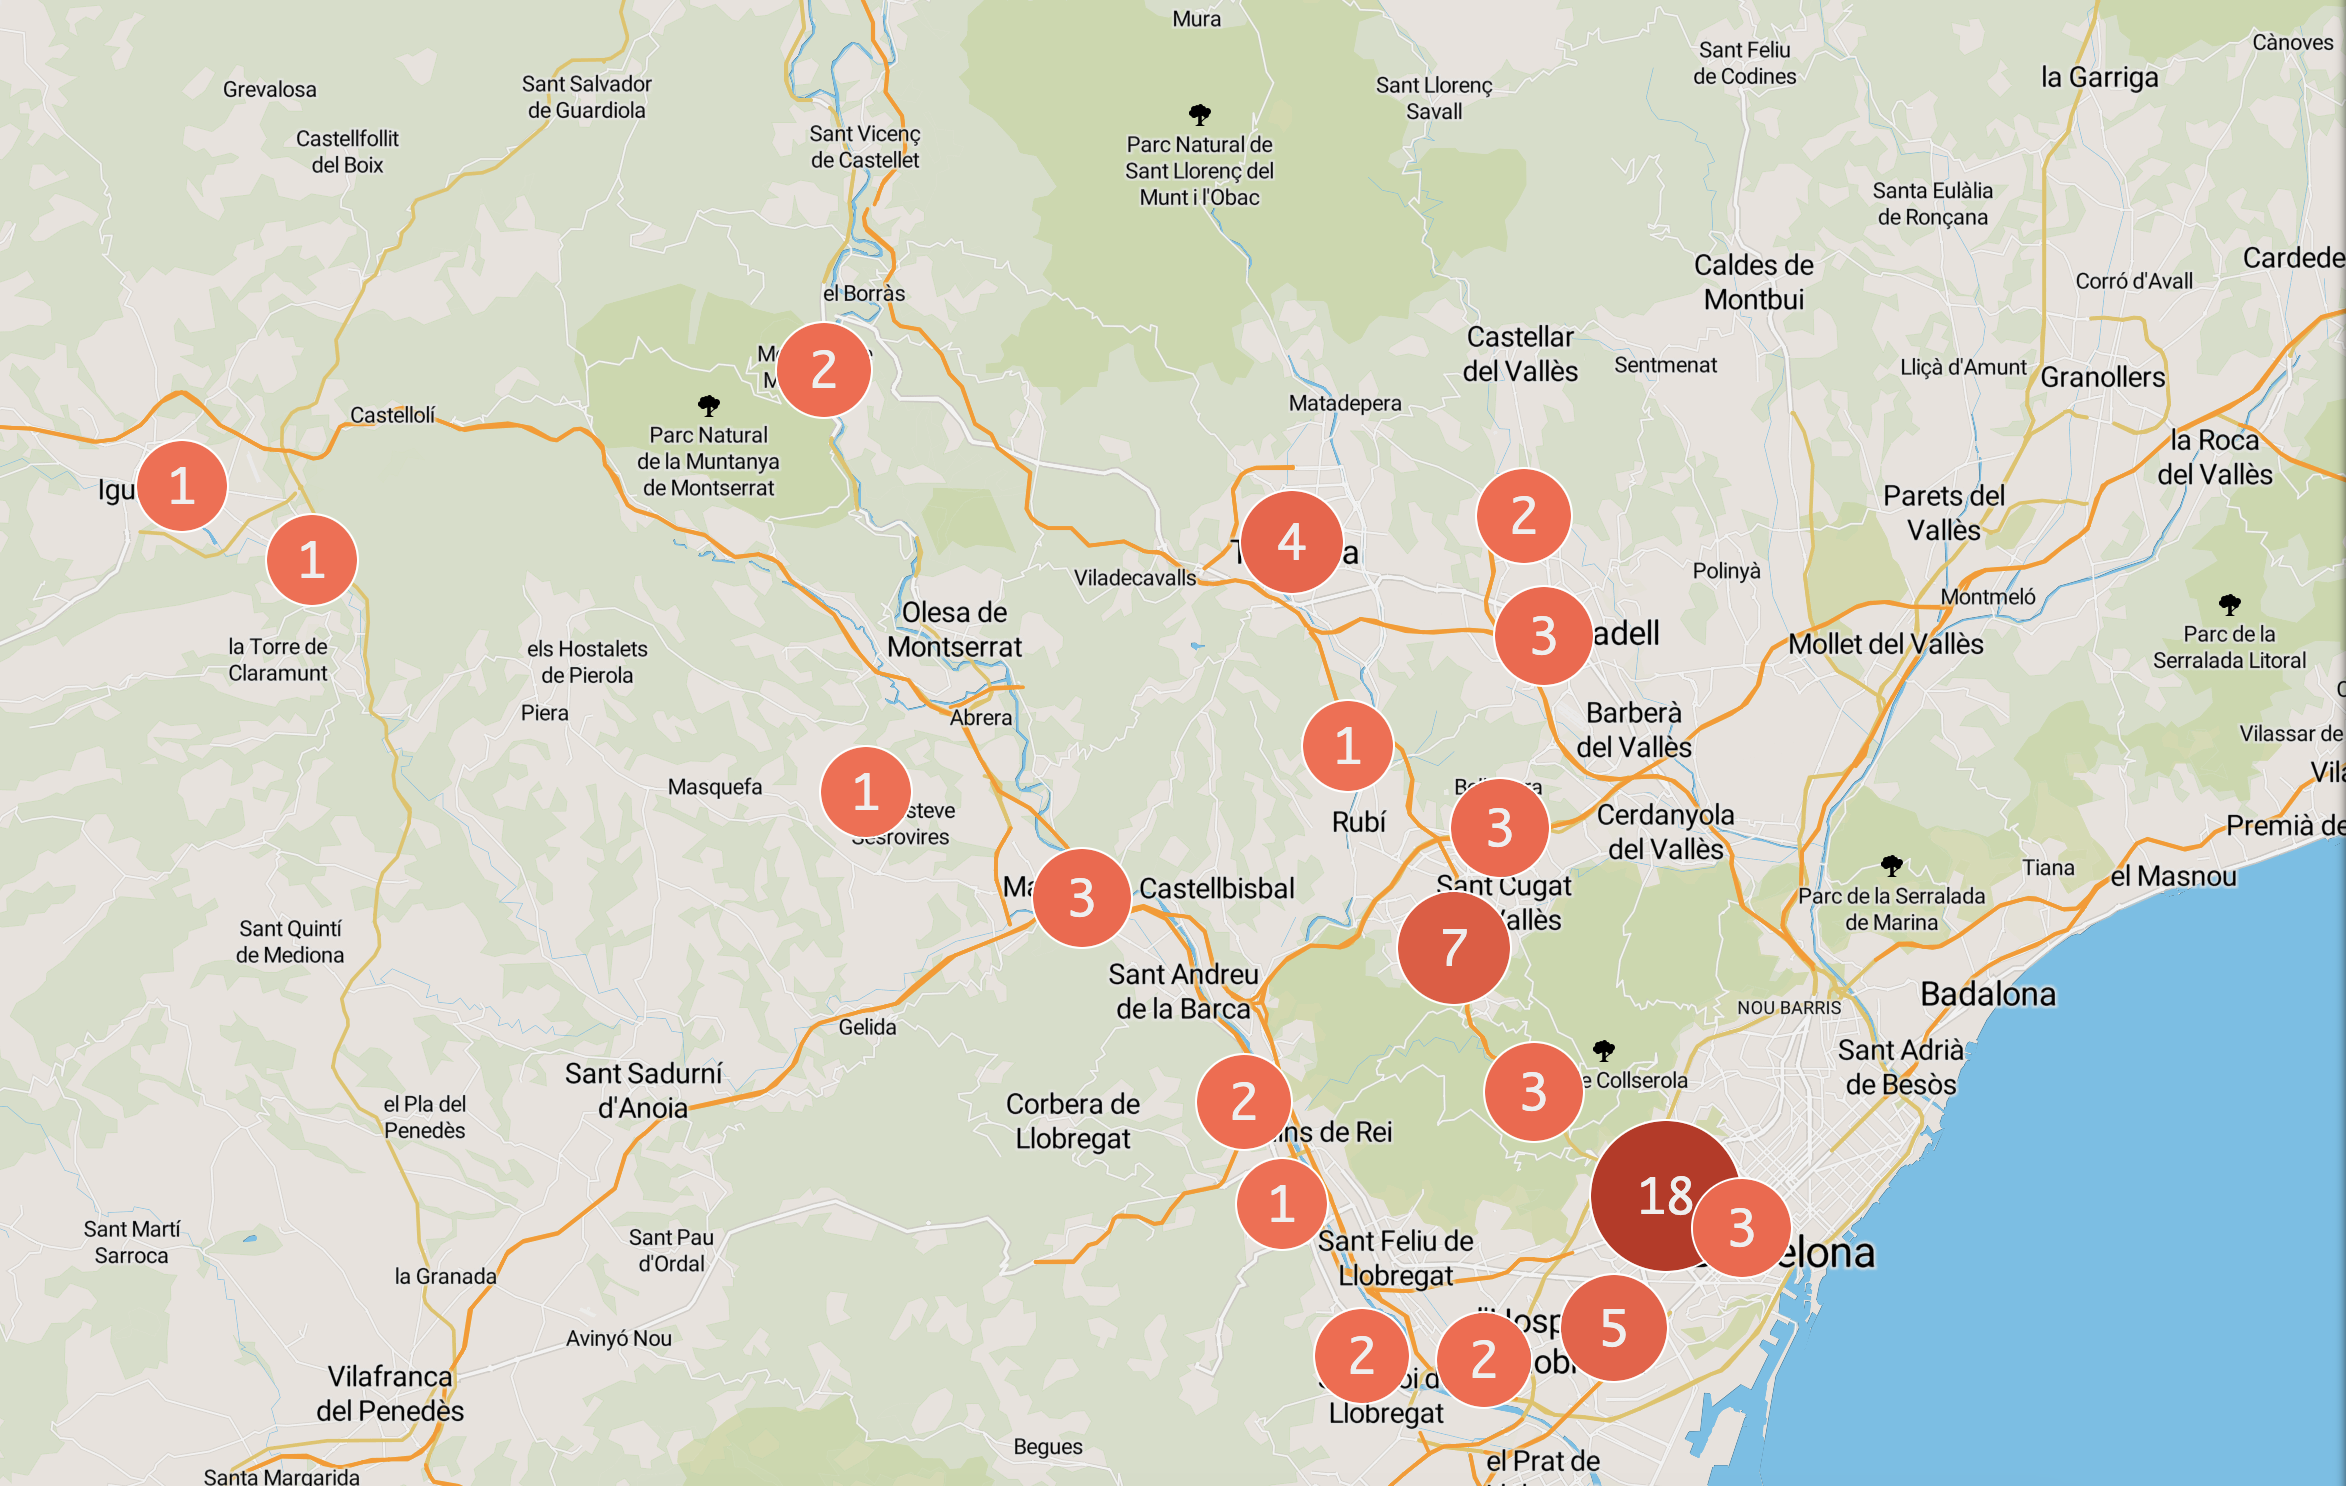
And here the example of the clustered mode :
Clustering is the default display mode (in the widgets, this is the "auto" map display mode).
In this mode, the map adapts to ensure the best experience for your users, from the initial display to further interactions such as zooming, moving, filtering, etc.
The map adjusts according to the following criteria:
If there are fewer than 200 elements visible on the map, they are all displayed as is, regardless of their being points or shapes.
If there are 200 or more elements to be displayed on the map:
If more than half the elements are points, all elements are clustered: Elements that are close together are grouped into a single cluster, with a number indicating how many elements the cluster regroups. For elements that are shapes (polygons, lines, etc.), their centroid is considered when situating the clusters. Clicking on a cluster zooms in, at which point the same rules are re-applied and may modify the display.
Otherwise, if half or more of the elements are shapes (polygons, lines, etc.), a maximum of 1,000 shapes are simplified so that they can still be displayed efficiently by all browsers and devices in a few seconds maximum.
These rules are reapplied after each move or zoom within the map. In particular, zooming on a zone with fewer elements to display will improve the precision and reduce the need for clusters.