
Configuring data visualizations
Although the visualizations of the created datasets are configured both in terms of content and appearance from the edition interface of the datasets themselves, some other global data visualizations configurations such as custom default chart colors, available basemaps, and default map locations, are managed from the Portal > Visualization settings subsection of the back office.
Configuring chart default colors
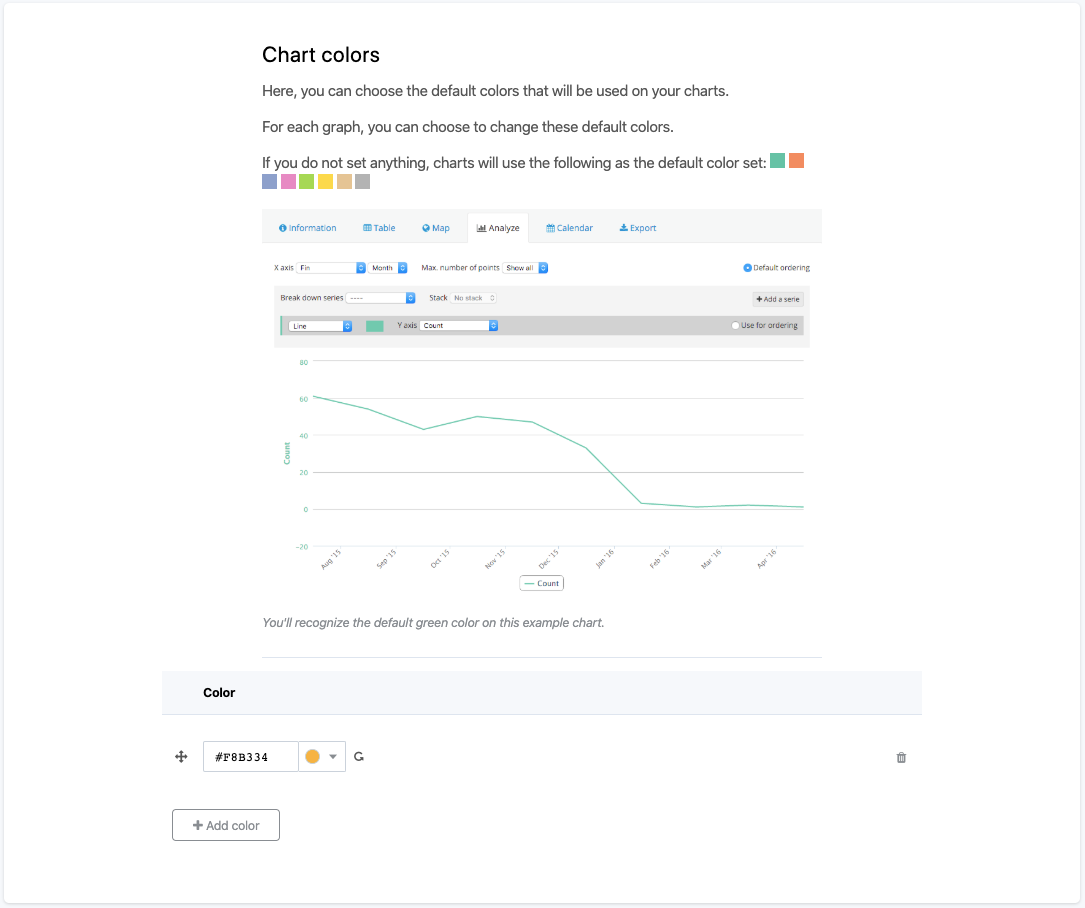
Charts are composed of at least one color, but depending on what they represent, they can be composed of many more. By default, a set of eight colors is used, and Opendatasoft users also have the possibility to use other sets of colors that are available by default as well. The Chart colors configuration allows to define a new set of colors that will replace the original eight-color set.
To add a new default chart color:
In the Visualization settings configuration interface, look for the Chart colors configuration.
Click on the + Add color button.
Add the hexadecimal code of the new color, or click the color button to choose a new color using either the "Nice colors" or the color wheel.
(optional) Click Reorder to reorganize the new color among the others. The order of the colors matters because they will be used one after the other by the chart.
Click Save in the top right corner of the page.
To delete a color, click the trash button.
Be careful when deleting chart colors: Visualizations configured with these specific custom colors may break.
Adding basemaps
Basemaps are the canvas on which geographic data are represented. They are used for any map displayed on Opendatasoft, whether it is the visualization map of a dataset or the Map Builder.
A basic basemap is used by default for all maps of all Opendatasoft workspaces. It is possible to change that default basemap, as well as to make other basemaps available in an Opendatasoft portal. It will allow users to change the basemap at any time on a map and even to change the default basemap of a specific dataset.
To know more about basemaps and how to use them, you can read our blog post: "What is a basemap, and how to choose the best one for your data".
To manage basemaps, look for the Basemaps configuration in the Visualization settings configuration interface.
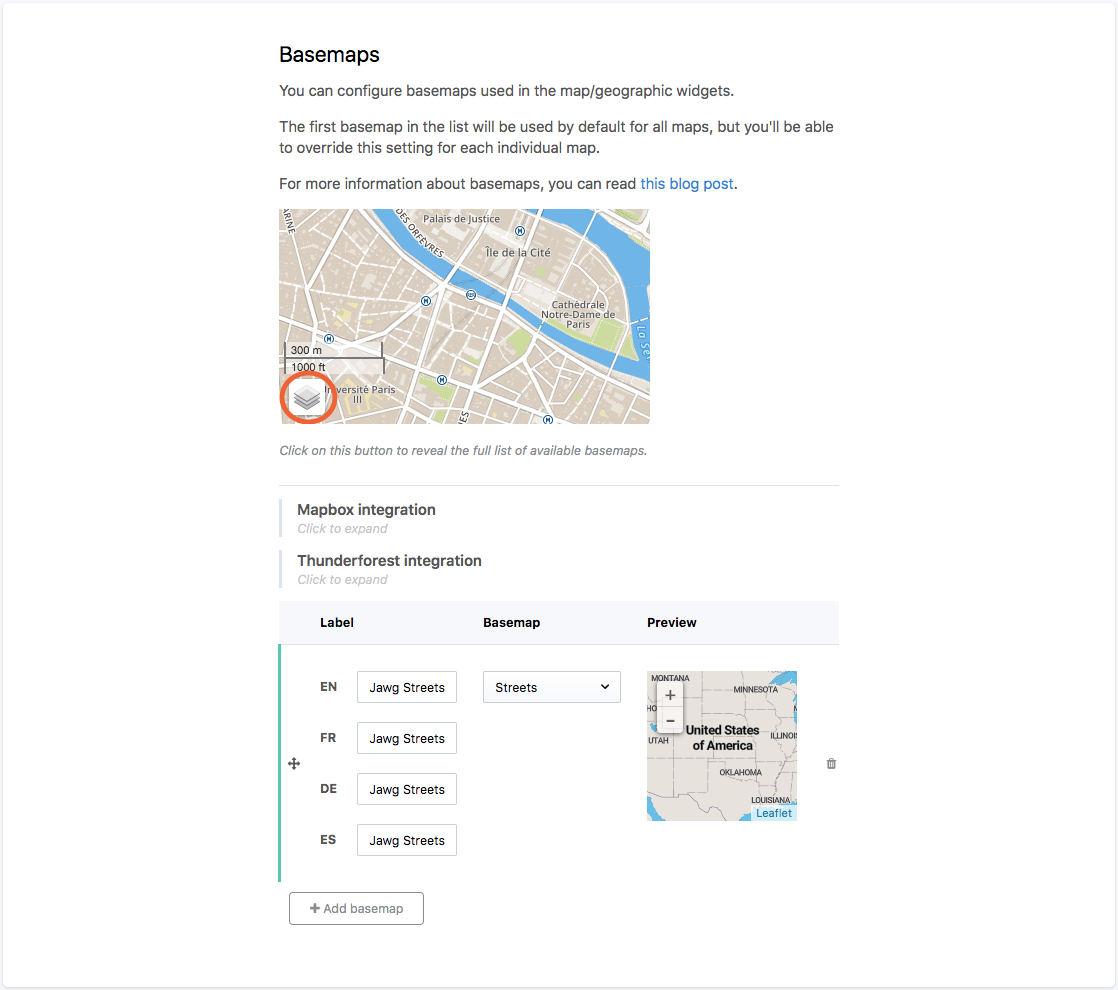
Basemaps should be managed from the table of the "Basemaps" configuration. This table displays the currently available basemaps that can be used on the workspace. It comprises three columns:
Label, to name the basemaps. Each basemap should have one label per language available on the workspace.
Basemap, to choose the basemap
Preview, to see what the basemaps look like
The basemaps table also contains two options:
The Reorder button to change the order of the basemaps. The first one is the default one on the whole workspace.
The Trash button to delete a basemap.
Adding default basemaps
By default, Opendatasoft provides several basemaps. They are the default basemaps displayed in the drop-down menu of the Basemap table column. All these default basemaps can be made available on the platform using the table. Even though the basemaps appear in the list of default basemaps, they will only be usable once added to the table.
To add default basemaps to the table and make them available on the workspace:
Click on the + Add basemap button under the table.
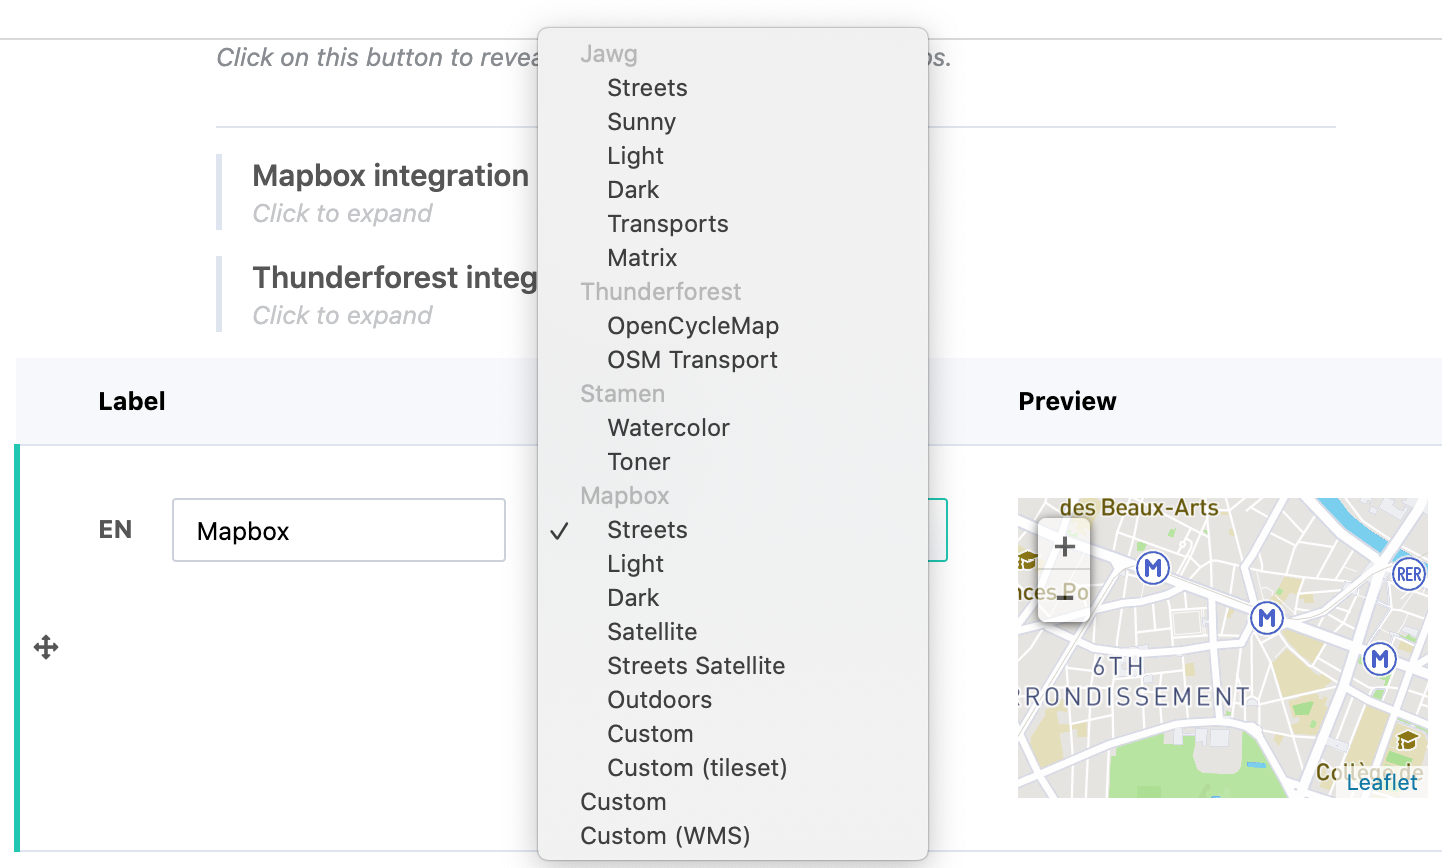
In the Basemap column, click on the drop-down menu. By default, it should display "Streets" (default basemap for all Opendatasoft workspaces).
The drop-down menu indicates all basemaps available in the workspace, ordered by basemap providers. Click on the basemap to add it to the workspace.
In the Label column, indicate a label for the newly added basemap. There must be one label per language (if the workspace supports more than one), otherwise the configurations cannot be saved.
Click on Save in the top right corner of the page.
Adding custom basemaps
Among the default basemaps, displayed in the drop-down menu of the Basemap table column, are two options that allow the addition of custom basemaps:
"Custom", to add TMS and other OpenStreetMap compatible basemaps
"Custom (WMS)", to add WMS basemaps
WMTS basemaps are not supported by the Opendatasoft platform.
To add a custom basemap to the workspace:
Click on the + Add basemap button.
In the Basemap column of the newly added row of the table, click on the drop-down menu.
In the drop-down menu, select either "Custom" or "Custom (WMS)". (If adding an IGN basemap, see here for more information.)
Fill up the basemap configurations.
If adding a "Custom" basemap, please refer to the table below:
Name
Description
Example
Tiles URL (required)
URL of the basemap.
http://tile.basemapprovider.io/{z}/{x}/{y}.pngSubdomains
Subdomains of the basemap (provided by the basemap provider). Subdomains must be separated with a comma.
a,b,c,d
Zoom min
Minimum zoom available (the most global view we can have of the map).
1
Zoom max
Maximum zoom available (the closer we can be into the map).
21
Attribution
Source of the basemap data. Will be displayed at the bottom of the basemap everywhere it is used.
Basemap data from OpenStreetMap
TMS service
Should only be checked in case the basemap is a strict TMS basemap, with inverted coordinates.
If adding a "Custom (WMS)" basemap, please refer to the table below:
Name
Description
Example
WMS URL (required)
URL of the basemap.
https://www.basemapprovider.com/wmsAttribution
Source of the basemap data. Will be displayed at the bottom of the basemap everywhere it is used.
Basemap data from OpenStreetMap
Layers (required)
Layer(s) of the basemap (provided by the basemap provider).
LayerName
Tiles images format
Format of the tiles: either .png or .jpeg (provided by the basemap provider).
Styles
Styles of the basemap (provided by the basemap provider).
DefaultStyle
Zoom min
Minimum zoom available (the most global view we can have of the map).
1
Zoom max
Maximum zoom available (the closer we can be into the map).
21
In the Label column, indicate a label for the newly added basemap. There must be one label per language (if the workspace supports more than one).
Click on the Save button in the top right corner of the page.
Adding external basemaps
Opendatasoft currently only allows the integration of Mapbox basemaps.
Although Thunderforest is presented in the interface as an available integration like Mapbox, it does not allow the integration of other Thunderforest basemaps. It only allows to have more quotas on the 2 Thunderforest basemaps available in the default basemaps list ("OpenCycleMap" and "OSM Transport").To fully use the default Thunderforest basemaps instead of within the default, limited quotas:1. Go to the Thunderforest website and sign in to your account.2. Copy the API Key.3. Go back to the Portal > Visualization settings subsection of your Opendatasoft back office.4. In the Basemaps configuration, click on "Thunderforest integration" to expand the related configurations.5. Paste the API Key in the textbox.
Mapbox integration
Mapbox is a mapping platform that allows to build and design custom maps. They also provide different basic map styles that can be directly used. Opendatasoft allows to integrate these Mapbox basemaps into an Opendatasoft workspace to make them available throughout the portal.
A Mapbox account is required. It is possible to create a Mapbox account for free, although it is going to have a small number of allowed "map views". See Mapbox plans for more information.
To integrate Mapbox basemaps:
Go to the Mapbox website and log in.
In the Mapbox account page, either copy the Default Public Token or create a new Public Token and copy it. This will be used by Opendatasoft to display maps on behalf of the user's own Mapbox account.
Go back to the Portal > Visualization settings subsection of your Opendatasoft back office.
In the Basemaps configuration, click on "Mapbox integration" to expand the related configurations.
Paste the Public Token in the textbox. A message will confirm whether the access token is valid or not.
Using the basemaps table, it is now possible to select one of Mapbox's default styles or add one of your own custom Mapbox basemaps:
In case of a "Tileset", enter the "Tileset ID" (which is usually under the form )
In case of a map style created using Mapbox Studio, enter the map identifier (usually under the form ), which is the last part of the "Style URL" provided by Mapbox (for example, means the map identifier is ).
Defining a default Map Builder location
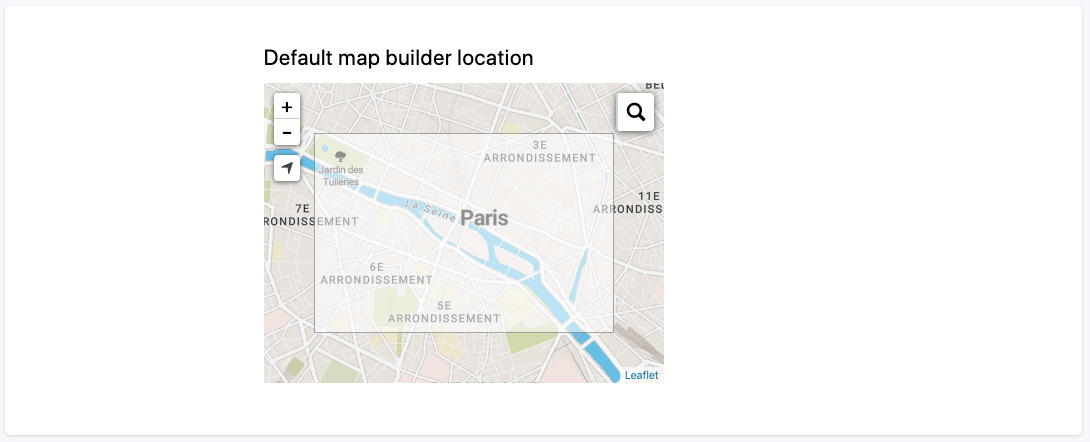
The Map Builder is Opendatasoft's tool to create advanced maps using one or more published dataset from one or more Opendatasoft portal. The Default map builder location configuration allows to define which location the Map Builder will focus on by default when landing on it.
In the Visualization settings configuration interface, look for the Default map builder location configuration.
Click on the map, and maintain the click while moving the map until the chosen location is enclosed in the rectangle. Some options are available to help to define the right location:
+ and - to zoom in or out
[] moves the map to your current location
The Magnifier icon allows you to make a textual search of a location
Click Save in the top right corner of the page.