
Configuring the map visualization
For the map visualization to be available, the dataset must contain at least one geographical field (Geo point or Geo shape).
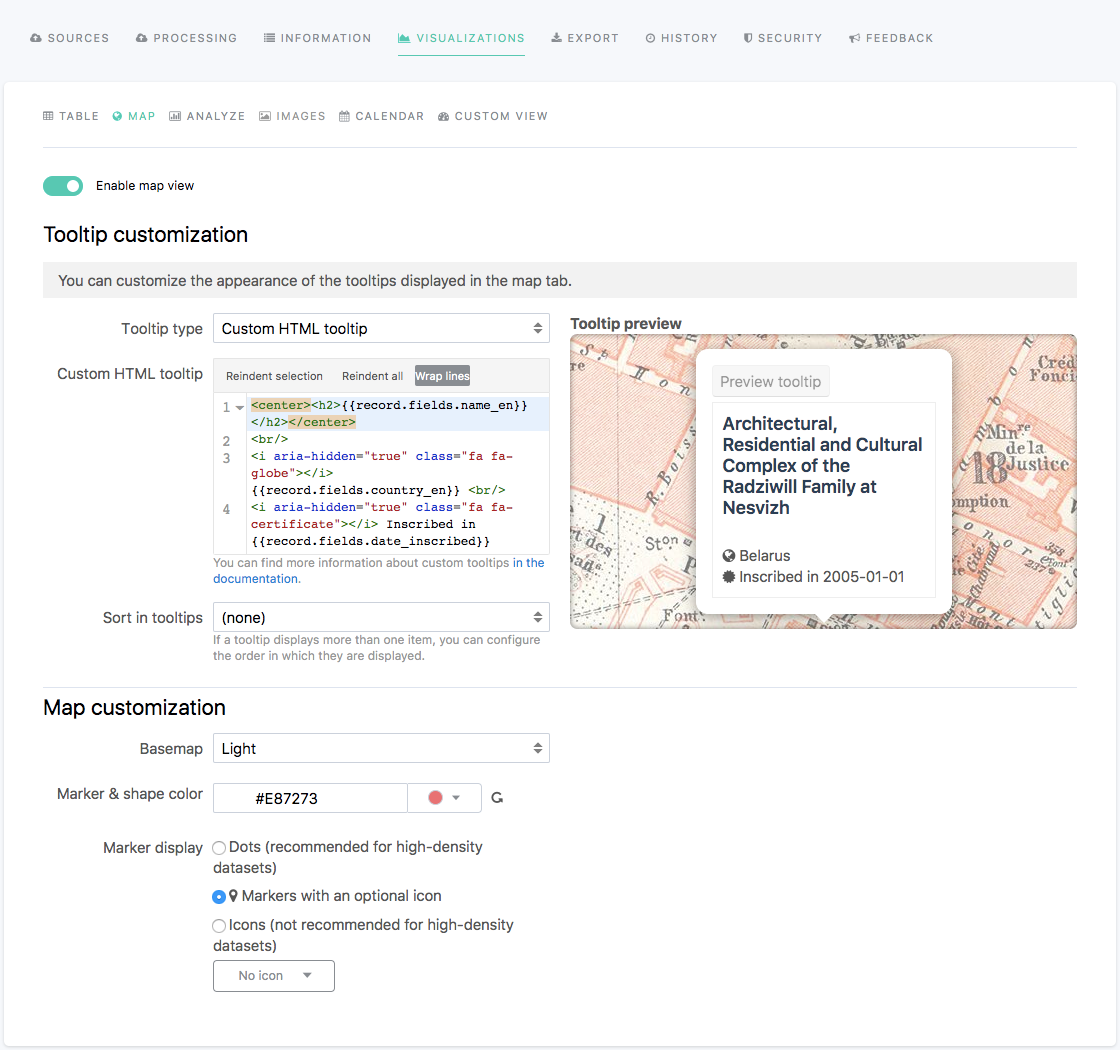
When editing a dataset, the Visualizations > Map tab allows you to configure the map visualization that is displayed in the portal once the dataset is published.
The map visualization, when available, is optional. It can be enabled or disabled using the tick box displayed right under the visualizations tabs.
Customizing the tooltip
The Tooltip customization section contains a variety of options to customize the tooltips that can be displayed on the map visualization of a dataset. A tooltip is a box that appears when clicking on an element of the map that represents data, for example a map marker or a geographical shape. The tooltip displays information about its related data.
For more information about tooltips and how to configure both Standard and Custom HTML tooltips, see Configure the tooltip documentation.
To customize the tooltips of the map visualization, follow the instructions from the tables below.
Option name | Description | Usage |
Tooltip type | Three tooltip types:
|
|
Standard tooltip options
Option name | Description | Usage |
Tooltip title | Title of the tooltip based on a chosen field from the dataset. |
|
Displayed fields | Fields from the dataset which values will be displayed in the tooltip. In the list, the fields with a grey background are those that will be displayed in the tooltip, whereas those without a colored background will be hidden from the tooltip. | To add a field in the tooltip:
To hide a field from the tooltip:
To reorder the fields:
|
Sort in tooltips | When there is more than one element at a single place on the map, clicking it will display a single tooltip, but where it is possible to browse information about all these elements. It is possible to define a sort to order that information. |
|


Custom HTML tooltip options
Option name | Description | Usage |
Custom HTML tooltip | HTML area to write the content of the tooltip. Three buttons above the text area allow to reindent a selection, reindent the whole HTML text, or to wrap the lines. | Write the content of the tooltip in HTML. |
Sort in tooltips | When more than one tooltip is related to the same element on the map, it is possible to define a sort to order these tooltips. |
|
Customizing the map
The Map customization section contains a variety of options to customize both the map itself (the basemap) and the elements that represent the data (map markers, geographical shapes).
To configure the map of the map visualization, follow the instructions from the table below.
Option name | Description | Usage |
Basemap | Basemap that will be used by default for the map visualization. To appear in the list, the basemaps should be configured in the Look & Feel > Data visualizations section of the back office (see Adding basemaps documentation). |
|
Marker & shape color | Color of the marker or shape on the map visualization. |
|
Marker display | Three possible ways to display markers:
| To choose a marker display, tick the box related to the chosen one. To choose an icon (either for the map markers or the icons displays):
|