 Getting started
 Exploring and using data
Exploring catalogs and datasets
Exploring a catalog of datasets
What's in a dataset
Filtering data within a dataset
An introduction to the Explore API
An introduction to the Automation API
Introduction to the WFS API
Downloading a dataset
Creating maps and charts
Creating advanced charts with the Charts tool
Overview of the Maps interface
Configure your map
Manage your maps
Reorder and group layers in a map
Creating multi-layer maps
Share your map
Navigating maps made with the Maps interface
Rename and save a map
Creating pages with the Code editor
How to limit who can see your visualizations
Archiving a page
Managing a page's security
Creating a page with the Code editor
Content pages: ideas, tips & resources
How to insert internal links on a page or create a table of contents
Sharing and embedding a content page
How to troubleshoot maps that are not loading correctly
Creating content with Studio
Creating content with Studio
Adding a page
Publishing a page
Editing the page layout
Configuring blocks
Previewing a page
Adding text
Adding a chart
Adding an image block to a Studio page
Adding a choropleth map block in Studio
Adding a points of interest map block in Studio
Adding a key performance indicator (KPI)
Configuring page information
Using filters to enhance your pages
Refining data
Managing page access
How to edit the url of a Studio page
Adding a map block in Studio
Visualizations
Managing saved visualizations
Configuring the calendar visualization
The basics of dataset visualizations
Configuring the images visualization
Configuring the custom view
Configuring the table visualization
Configuring the map visualization
Understanding automatic clustering in maps
Configuring the analyze visualization
 Publishing data
Publishing datasets
Creating a dataset
Creating a dataset from a local file
Creating a dataset with multiple files
Creating a dataset from a remote source (URL, API, FTP)
Creating a dataset using dedicated connectors
Creating a dataset with media files
Federating an Opendatasoft dataset
Publishing a dataset
Publishing data from a CSV file
Publishing data in JSON format
Supported file formats
Promote mobility data thanks to GTFS and other formats
Configuring datasets
Automated removal of records
Configuring dataset export
Checking dataset history
Configuring the tooltip
Dataset actions and statuses
Dataset limits
Defining a dataset schema
How Opendatasoft manages dates
How and where Opendatasoft handles timezones
How to find your workspace's IP address
Keeping data up to date
Processing data
Translating a dataset
How to configure an HTTP connection to the France Travail API
Deciding what license is best for your dataset
Types of source files
OpenStreetMap files
Shapefiles
JSON files
XML files
Spreadsheet files
RDF files
CSV files
MapInfo files
GeoJSON files
KML/KMZ files
GeoPackage
Connectors
Saving and sharing connections
Airtable connector
Amazon S3 connector
ArcGIS connector
Azure Blob storage connector
Database connector
Dataset of datasets (workspace) connector
Eco Counter connector
Feed connector
Google BigQuery connector
Google Drive connector
How to find the Open Agenda API Key and the Open Agenda URL
JCDecaux connector
Netatmo connector
OpenAgenda connector
Realtime connector
Salesforce connector
SharePoint connector
U.S. Census connector
WFS connector
Databricks connector
Harvesters
Harvesting a catalog
ArcGIS harvester
ArcGIS Hub Portals harvester
CKAN harvester
CSW harvester
FTP with meta CSV harvester
Opendatasoft Federation harvester
Quandl harvester
Socrata harvester
data.gouv.fr harvester
data.json harvester
Processors
What is a processor and how to use one
Add a field processor
Compute geo distance processor
Concatenate text processor
Convert degrees processor
Copy a field processor
Correct geo shape processor
Create geo point processor
Decode HTML entities processor
Decode a Google polyline processor
Deduplicate multivalued fields processor
Delete record processor
Expand JSON array processor
Expand multivalued field processor
Expression processor
Extract HTML processor
Extract URLs processor
Extract bit range processor
Extract from JSON processor
Extract text processor
File processor
GeoHash to GeoJSON processor
GeoJoin processor
Geocode with ArcGIS processor
Geocode with BAN processor (France)
Geocode with PDOK processor
Geocode with the Census Bureau processor (United States)
Geomasking processor
Get coordinates from a three-word address processor
IP address to geo Coordinates processor
JSON array to multivalued processor
Join datasets processor
Meta expression processor
Nominatim geocoder processor
Normalize Projection Reference processor
Normalize URL processor
Normalize Unicode values processor
Normalize date processor
Polygon filtering processor
Replace text processor
Replace via regular expression processor
Retrieve Administrative Divisions processor
Set timezone processor
Simplify Geo Shape processor
Skip records processor
Split text processor
Transform boolean columns to multivalued field processor
Transpose columns to rows processor
WKT and WKB to GeoJson processor
what3words processor
Data Collection Form
About the Data Collection Form feature
Data Collection Forms associated with your Opendatasoft workspace
Create and manage your data collection forms
Sharing and moderating your data collection forms
Dataset metadata
![]() Analyzing how your data is used
Analyzing how your data is used
Getting involved: Sharing, Reusing and Reacting
Discovering & submitting data reuses
Sharing through social networks
Commenting via Disqus
Submitting feedback
Following dataset updates
Sharing and embedding data visualizations
Monitoring usage
An overview of monitoring your workspaces
Analyzing user activity
Analyzing actions
Detail about specific fields in the ods-api-monitoring dataset
How to count a dataset's downloads over a specific period
Analyzing data usage
Analyzing a single dataset with its monitoring dashboard
Analyzing back office activity
 Managing your users
Managing limits
Managing users
Managing users
Setting quotas for individual users
Managing access requests
Inviting users to the portal
Managing workspaces
 Managing your portal
Configuring your portal
Configure catalog and dataset pages
Configuring a shared catalog
Sharing, reusing, communicating
Customizing your workspace's URL
Managing legal information
Connect Google Analytics (GA4)
Regional settings
Pictograms reference
Managing tracking
Look & Feel
Branding your portal
Customizing portal themes
How to customize my portal according to the current language
Managing the dataset themes
Configuring data visualizations
Configuring the navigation
Adding IGN basemaps
Adding assets
Plans and quotas
Managing security
Configuring your portal's overall security policies
A dataset's Security tab
Mapping your directory to groups in Opendatasoft (with SSO)
Single sign-on with OpenID Connect
Single sign-on with SAML
Parameters
Using the data lineage dashboard

The lineage dashboard gives you a quick and comprehensive overview of metrics and data about your objects' lineage (Business lineage). We've designed it to be user-friendly, with intuitive navigation and search capabilities to help you navigate what might otherwise seem like an overwhelming amount of information.
Understanding your ecosystem
The lineage dashboard provides a comprehensive visual representation of the way your datasets are being used by others, as well as the way you're using datasets from elsewhere on your portal.
To toggle between these two views—datasets and portal, click on the tabs near the top.
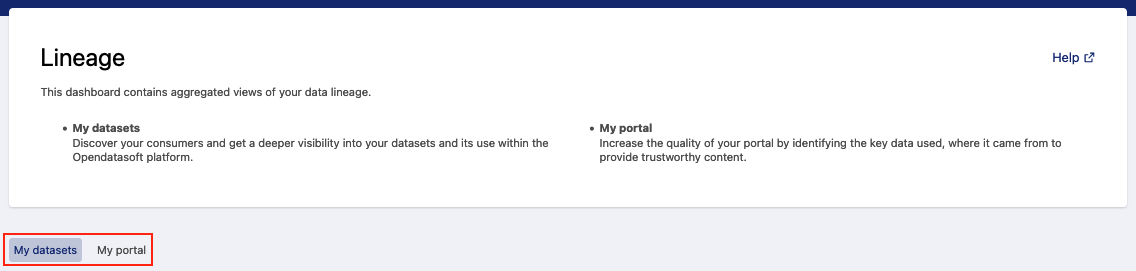
My datasets
Understand the impact of your datasets
The My datasets tab tells you how your datasets are being used, and give you insight into their impact throughout the rest of the Opendatasoft platform. Use it to explore different data and answer questions such as, "What is the purpose of my datasets? Who are my consumers? And how are they consuming my data to enrich or create content?"
My portal
Optimize the management of your portal
The My portal tab is dedicated to your workspace. Here, you can see incoming relationships from external datasets, as well as internal relationships between your own ODS objects. Being able to visualize these relationships will help you better manage your workspace, discover which datasets are most critical to your own content, see which workspaces you depend on, and verify the sources of your objects.
-> The impact of my datasets within the Opendatasoft platform.
-> The management of dependencies of my data and content on my portal.
How both tabs are structured
The two tabs show different data, but they have the same overall structure:
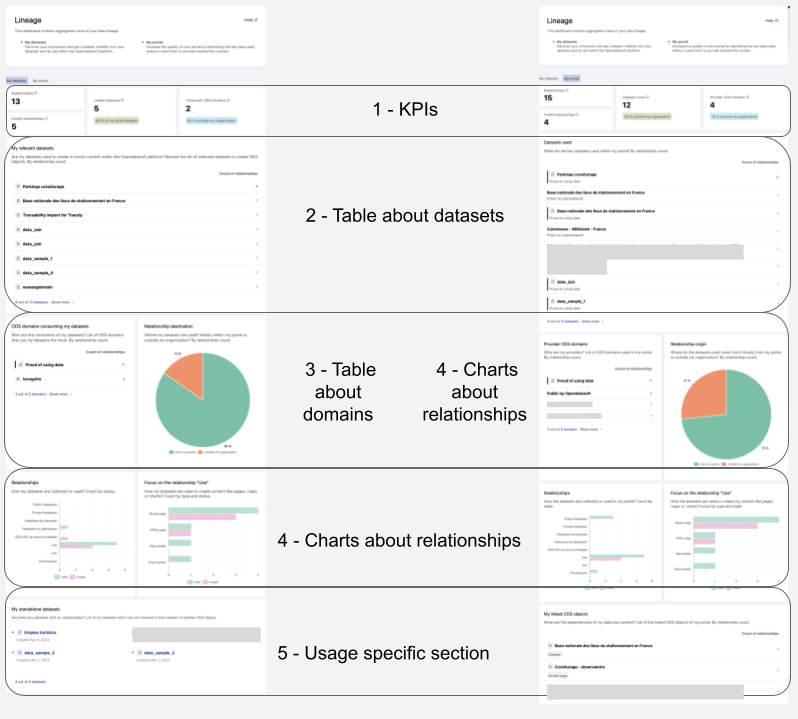
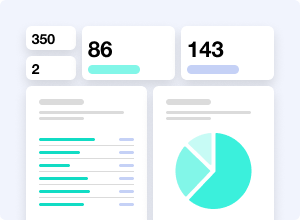
- KPIs: The top section presents four indicators on the density and health of the network around your datasets or portal.
- Table about datasets: This main table identifies the key datasets among either your datasets or on your portal.
- Table about workspaces: This table identifies the workspaces of the Opendatasoft platform related to your datasets or portal.
- Charts about relationships: These three charts present the distribution of relationships according to their origin, destination, or type.
- Usage-specific section: Finally, a table presents additional information such as standalone datasets for the My datasets tab or linked ODS objects for the My portal tab.
The "My datasets" tab
Both tabs have the same overall structure (see above), but is is the data specific to the My datasets tab:
KPIs
The "My datasets" dashboard provides four key performance indicators:
- Relationships: This KPI measures the overall number of direct relationships between your datasets and other ODS objects, where your datasets are the origin of those ODS objects. This KPI can help assess the breadth of the relationships originating with your datasets, and provides insight about how your data contributes to building other ODS objects.
- Invalid relationships: This KPI measures the number of direct relationships that are identified as invalid with your datasets as the origin.
- Linked datasets: This KPI measures the number of your datasets that are the origin of at least one relationship, and that are successfully linked with other ODS objects. It also measures the percentage of your total datasets that are linked in this way.Note that this percentage is calculated with the total number of both published and unpublished datasets.
- Consumer workspaces: This KPI measures the number of unique Opendatasoft workspaces consuming your datasets. It also measures the percentage of these workspaces that are outside your organization (that aren't your primary or secondary workspaces). These help assess the reach and impact of your data, as well as the adoption of your data by external Opendatasoft workspaces.
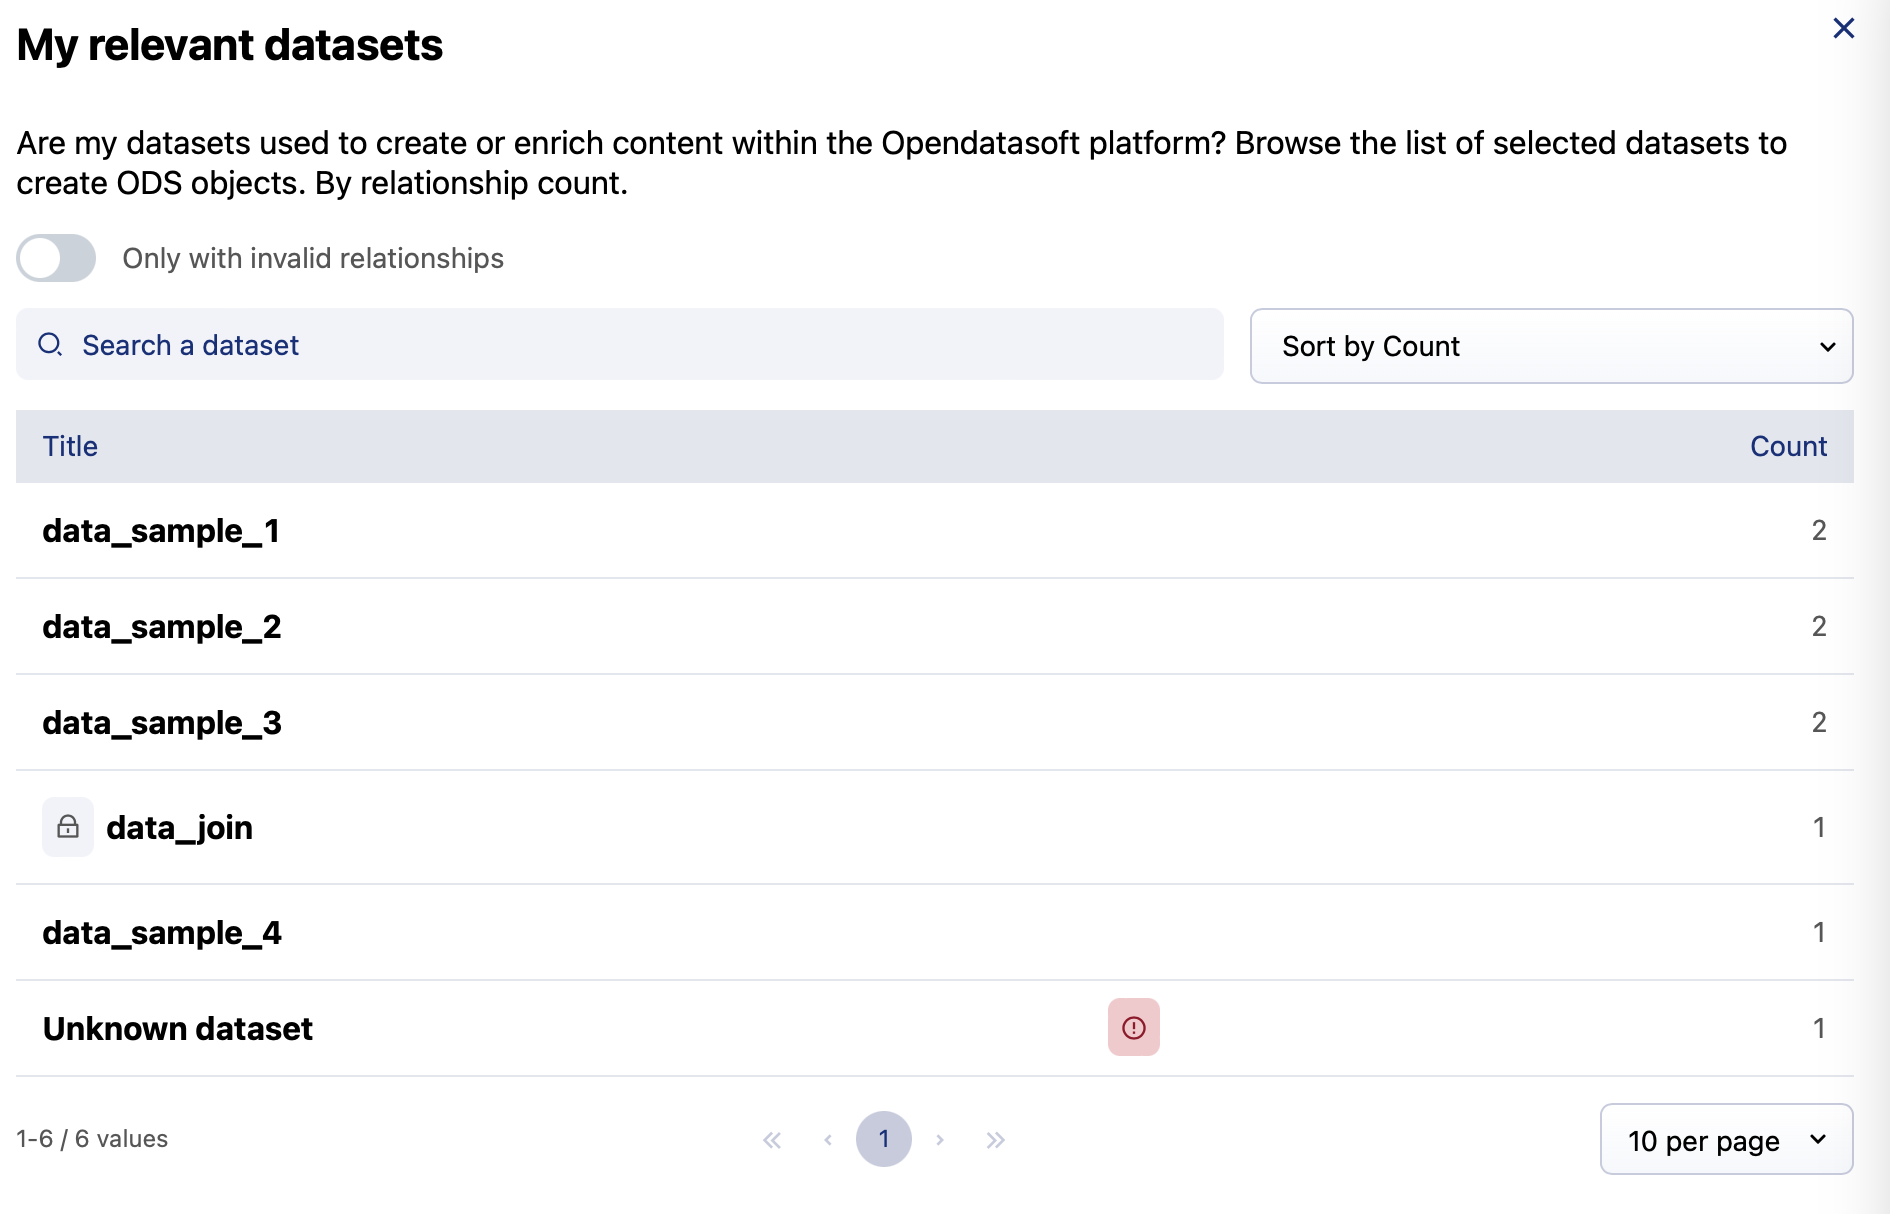
My relevant datasets
"Are my datasets used to create or enrich content within the Opendatasoft platform?"
This table presents a list of your datasets ranked by the number of relationships with that dataset as their origin. Higher counts indicate a higher level of interconnectivity and reuse.
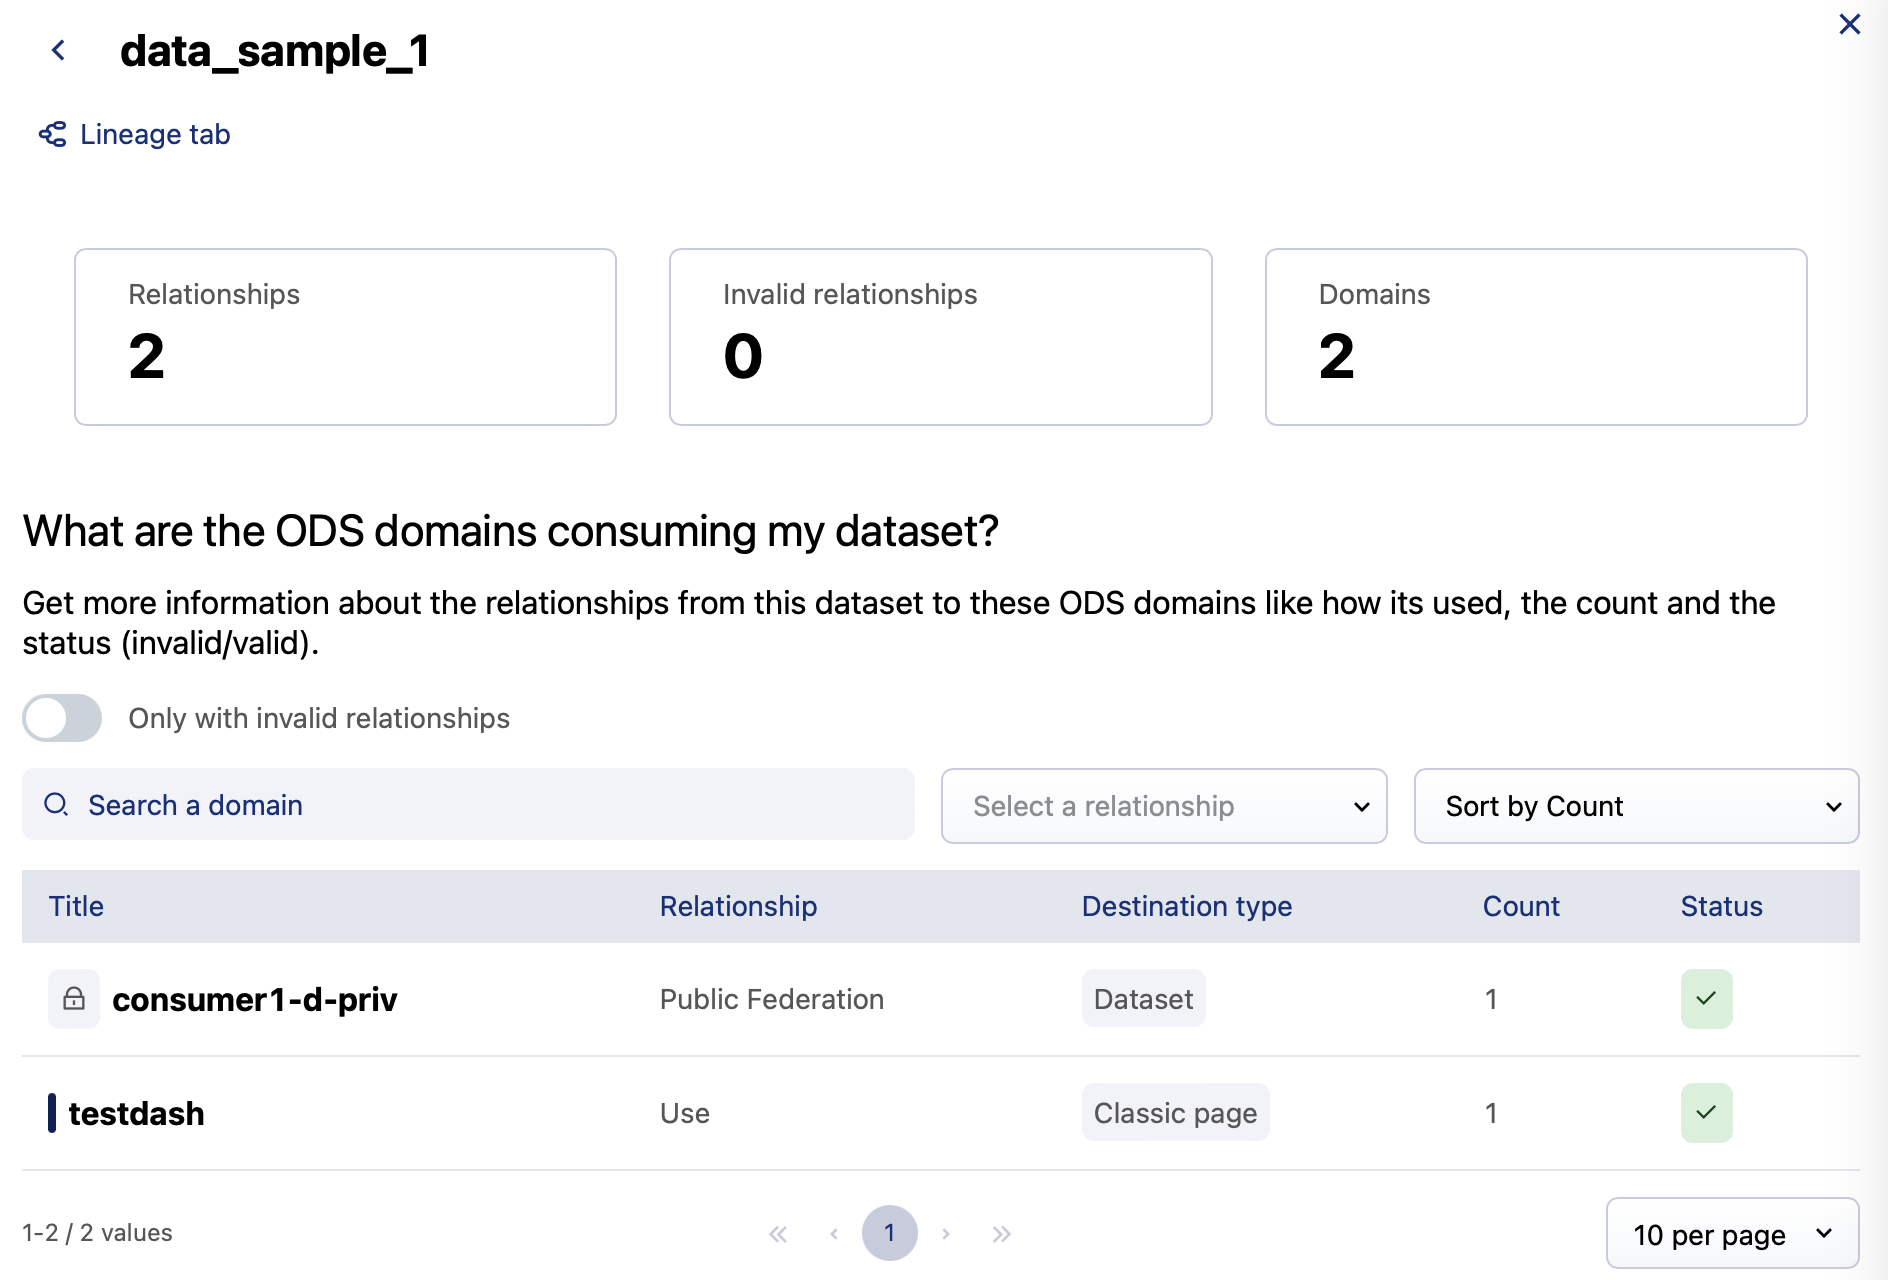
Click on an individual dataset to see more detailed information about its relationships, including the ODS workspaces currently using it.
Click on Show more to access the complete list with search and filter functions.
Workspaces consuming my datasets
"Who is using my datasets?"
This table presents the list of workspaces consuming your datasets ranked by their number of relationships. A higher count indicates a higher level of dependency on your data.
Click on an workspace to see which of your datasets are linked there, with more detailed information about those relationships.
Click on Show more to access the complete list with search and filter functions.
Three charts about relationships
These three charts can be valuable tools for analyzing and understanding the composition of relationships with your datasets as their origin.
Relationship destination
"Where my datasets are used? Mostly within my portal, or outside my organization?"
This pie chart represents the distribution of several categories of relationships.
- To my portal: These are relationships where the destination is an ODS object in your primary workspace.
- Outside my organization: These are relationships where the destination is an ODS object on an external ODS workspace.
- To my workspaces: These are relationships where the destination is an ODS object on one of your secondary workspaces.
Relationships
"How are my datasets collected or used?"
This chart presents the distribution of the main relationship type used to get your datasets (federation, use, etc.). The datasets are also broken down by valid or invalid relationship.
Focus on the relationship “use”
"How are my datasets used to create content such as pages, maps, or charts?"
This chart focuses on the data of the chart described above, filtered for the relationship type "use" (Code editor pages, Studio content pages, map or chart builder content). Here also the datasets are also broken down by valid or invalid relationship.
My standalone datasets
"Do I have any datasets with no relationships?"
This is a list of datasets that are not involved in the construction of any other ODS object. There are no relationships between these standalone datasets as origin and other ODS objects as destination.
Explore these datasets to understand why they're not being used, and proceed to management tasks (cleaning, improvement, check monitoring page, etc.)
The "My portal" tab
Both tabs have the same overall structure (see above), but this is the data specific to the My portal tab:
KPIs
The "My portal" dashboard provides four key performance indicators:
- Relationships: This KPI measures the overall number of direct relationships that have your ODS objects as their destination. It provides insights about which key datasets are involved in the construction of your ODS objects.
- Invalid relationships: This KPI measures the number of invalid direct relationships that have one of your ODS objects as their destination. Invalid relationships could result from data entry errors, inconsistencies, or missing data. Tracking this KPI can help identify data quality issues and highlight areas that require data cleansing or validation efforts to ensure accuracy and reliability in your portal.To quickly see the list of your ODS objects with invalid relationships, click on the arrow!
- Datasets used: This KPI measures the number of datasets used within your portal. This KPI provides insights about key datasets involved in the construction of your ODS objects. The percentage of total datasets outside your organization tells you how dependent you are on datasets that are maintained outside your own workspaces.
- Provider workspaces: This KPI measures how many ODS workspaces contribute data to your portal. The percentage shows what share of those are not from your own workspaces. This can provide insight into the diversity of your sources, as well as how dependent you are on ODS workspaces outside your own.
Datasets used
"What are the key datasets used within my portal?"
This table displays the datasets you use in your portal, ranked by the number of relationships with one of your ODS objects as their destination. Higher counts indicate a higher level of interconnectivity and reuse inside your portal.
Click on a dataset to see the linked ODS workspaces with detailed information about those relationships.
Click on Show more to access the complete list with search and filter functions.
Provider workspaces
"Who are my providers?"
This table presents the data providers linked in your portal, ranked by the number of relationships with one of your ODS objects as their destination. If you use some datasets from external Opendatasoft workspaces, you can see the depedencies with these customers. Higher counts indicate a higher level of dependency between your portal and other Opendatasoft workspaces.
Click on a workspace to see the datasets used with detailed information about their relationships.
Click on Show more to access the complete list with search and filter functions.
Graphs about relationships
These three charts can be valuable tools for analyzing and understanding the composition of relationships within your portal.
Relationship origin
"Where do the datasets used come from? Mostly from my portal or outside my organization?"
This pie chart represents the distribution of the relationships with your ODS objects as their destination.
It is divided into slices representing the different categories of relationships.
- From my portal: These are relationships where the origin is a dataset on your primary workspace.
- Outside my organization: These are relationships where the origin is a dataset from an external Opendatasoft workspace.
- From my workspaces: These are relationships where the origin is a dataset from one of your secondary workspaces.
Relationships
"How are the datasets collected or used in my portal?"
This chart presents the distribution of the main relationship types used in your portal (federation, use, etc.) The datasets are also categorized by valid or invalid status.
Focus on the relationship “use”
"How are the datasets used to create my content, such as pages, maps, or charts?"
This chart focuses on the data from the previous chart, filtered for the relationship type "use" (Code editor pages, Studio pages, map or chart builder objects). Here also, the datasets are also categorized by valid or invalid status.
My linked ODS objects
"What are the dependencies of my data and content? What is the list of the ODS objects linked on my portal."
As a portal administrator, it's important to understand how your datasets are built, as well as the reliability of their dependencies.
For example, if you are planning to update or delete a dataset that is linked to several other pages, understanding these dependencies can help you assess the impact that deletion would have.
Linked objects are datasets, pages, or map or chart builder objects with at least one relationship. The table lists the linked objects with their type, and you can explore what the dependencies of each object is.
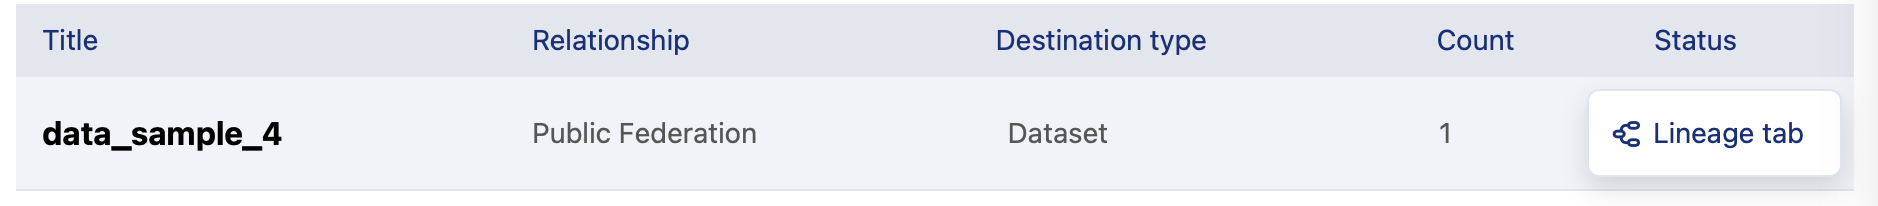
Click on an object to see detailed information about the relationships and the assets used.
Click on Show more to access the complete list with search and filter functions.
Digging deeper into your data
Each table in the dashboard shows only the top eight entries. Naturally, by clicking on Show more at the bottom of the list, you can access the complete list with search and filter functions.
Then, by clicking on an object, you can get details on its different dependencies, with additional search and filter functions.