Opendatasoft has already begun harnessing the power of AI to allow users to perform new tasks, or make existing tasks easier and faster. With this in mind, we've released a feature called "Explore data with AI."
Explore data with AI is designed to allow you to ask simple, natural-language questions of any dataset—and even to obtain quick visualizations based on the results. You can use it to quickly query a dataset, and to verify that the dataset has what you need.
To get the most out of the feature, it's helpful to keep a few things in mind.
A few principles and best practices
Use natural-language requests, and keep them simple and unambiguous. If it might confuse a human, the bot is unlikely to do any better!
The bot is limited by what's actually in the dataset and by the dataset's schema. For example, this means that the bot can't make a map without actual geographic data. But it also means that if your query uses terms that are rare or absent from the dataset, the bot may struggle to correctly respond to your query.
Use the Show reasoning button to understand or verify the answer you were given.
The bot can currently display information in one of four ways: As a single number, a column chart, a line chart, or a point of interest map. It can help to specify which one you want.
The bot can generally perform the following functions: count the total number of records, the number of distinct records, return a minimum or maximum value, do sums, or return an average or median value.
In more detail
Use natural-language requests, and keep them simple and unambiguous. In conversation, we might be able to intuit the meaning of an ambiguous question, but other times the wording is simply unclear. For example, if someone asked "Show the expenses and revenue by department where revenue is above $1 million," it might not be clear if "where revenue is above $1 million" refers only to revenue, or applies to expenses. The bot is likely to assume you want it to apply to both. So remember that you'll have more success if your requests are simple and clear.
The bot is limited by what's actually in the dataset and by the dataset's schema. As noted above, for example this means that the bot can't make a map without actual geographic data. The same is true for numbers or dates. The data must have the appropriate type and be correctly formatted for the bot to be able to make the relevant visualization.
Note that some data may only seem like it can be mapped. A dataset might be organized by city, so have a column with city names, but not provide actual geographic data. Imagine "Paris" was one of those cities. Paris, France, is in fact not the only "Paris" in the world. The intended Paris may seem obvious, but the bot simply can't invent details the dataset does not already include.
This also means that if your query uses terms that are rare or absent from the dataset, the bot may struggle to appropriately respond to your query. As such, it can be helpful to have a look at the data itself, and adjust your query accordingly. It may take several tries before you find the formulation precise enough for the bot to understand.
Examples:
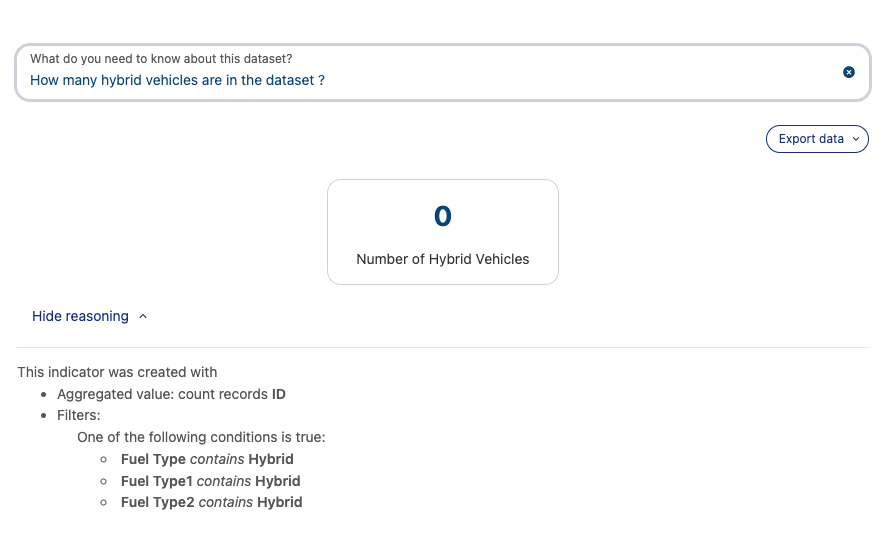
For example, the All Vehicles Model dataset, a dataset collected by the U.S. Environmental Protection Agency, lists over 47,000 vehicles with information about their fuel type and efficiency. We might want to know how many models are hybrids, and so ask "How many hybrid vehicles are in the dataset?"
The bot fails
As you can see below, though in fact there are hybrids in the dataset, the bot has returned 0. When we examine its reasoning, we can see why. Though upon examination the "Fuel Type" column is indeed where the answer is located, the bot apparently was looking for the value "Hybrid" when in fact the relevant value is "Electricity."In the data, we can see that "Electricity" is listed either on its own, for fully-electric cars, or along with another fuel type, in the case of hybrids.
Keeping it simple
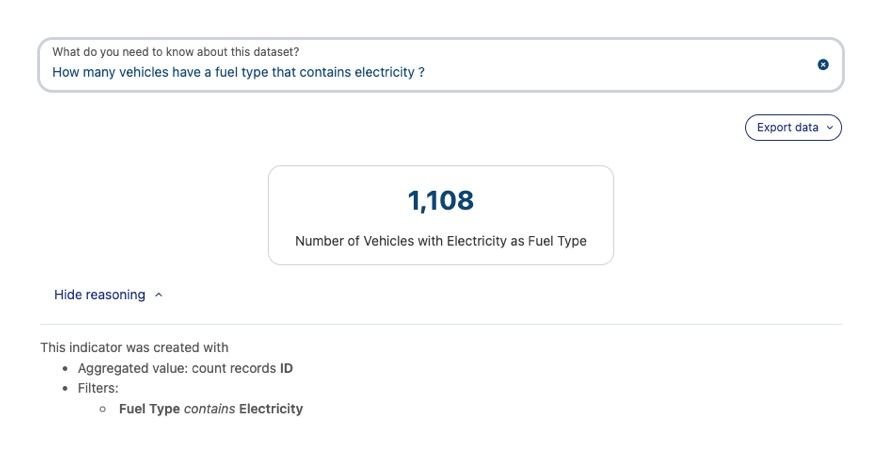
Let's see if we can get the number of all electric vehicles, both fully-electric and hybrid. We might ask, "How many vehicles have a fuel type that contains electricity?" And it returns the answer: 1,108.How about only fully-electric vehicles? If we ask, "How many vehicles have a fuel type that contains only electricity?" we get the answer: 766.A quick subtraction, and we conclude that there are 342 hybrids.
A more direct method
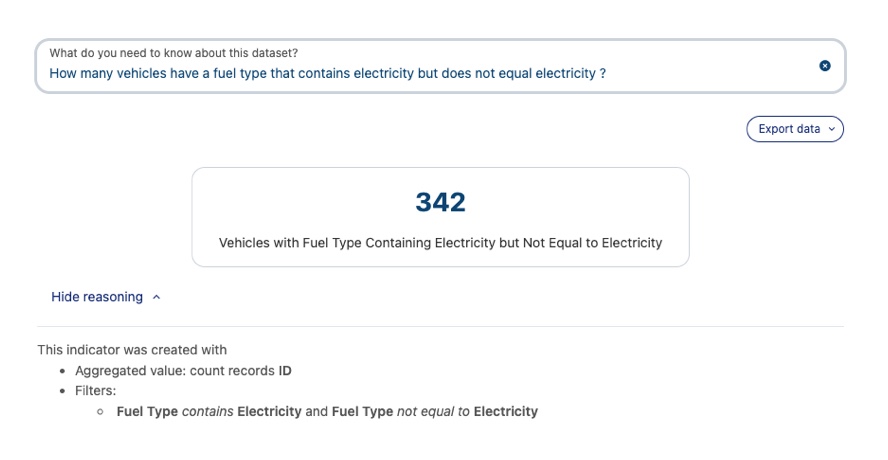
We risk confusing the bot, but we can try to obtain the answer directly by asking something like, "How many vehicles have a fuel type that contains electricity but does not equal electricity?" And here we also get our answer: 342.
Be sure to have a look at the Show reasoning button to understand or verify the answer you were given. As can be seen in the examples above, the information provided here can be critical if you want insight into what the bot is doing—or potentially what the dataset might be missing.
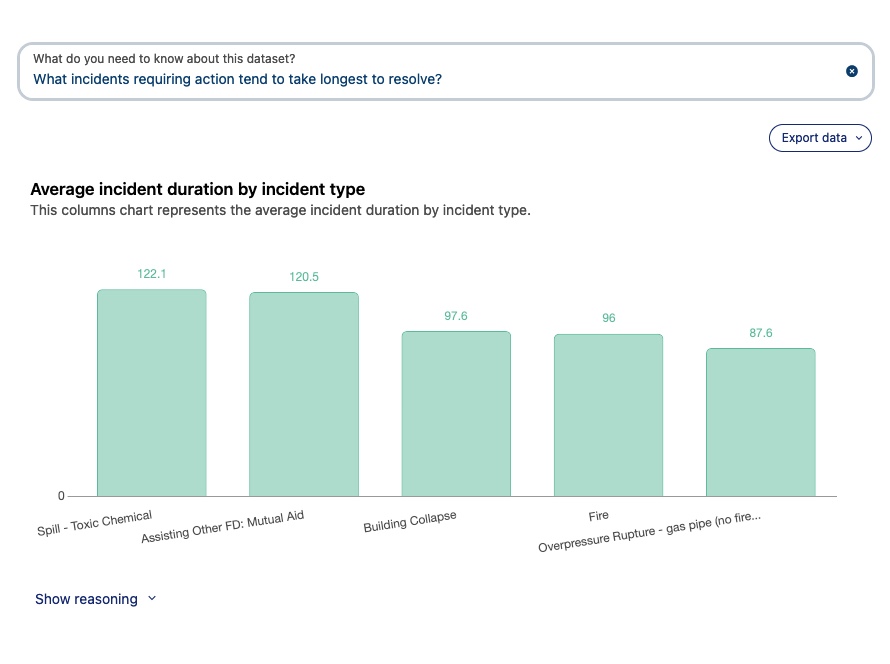
The bot can currently display information in one of four ways: As a single number, a column chart, a line chart, or a point of interest map. If can help to specify which one you want.
Note that this means you can't ask the bot a yes or no question—at least not directly. For example, imagine you have a dataset of parking lots, their capacities, and how many parking spots are currently occupied. You want to know if there are currently any parking lots at full capacity. So instead of asking if there are any full lots, you instead can ask how many there are. If the answer is "12," you have both the answer to your original question (yes, there are), but you also know how many!
The same is true for an answer in the form of a word or words. If you wanted to know what size of shoe was most popular in your shoe store dataset, you wouldn't ask that question directly. Instead, ask it to chart the sizes by number sold. Not only will you see which size has the biggest bar, but you'll have a sense of the distribution in the data as well!
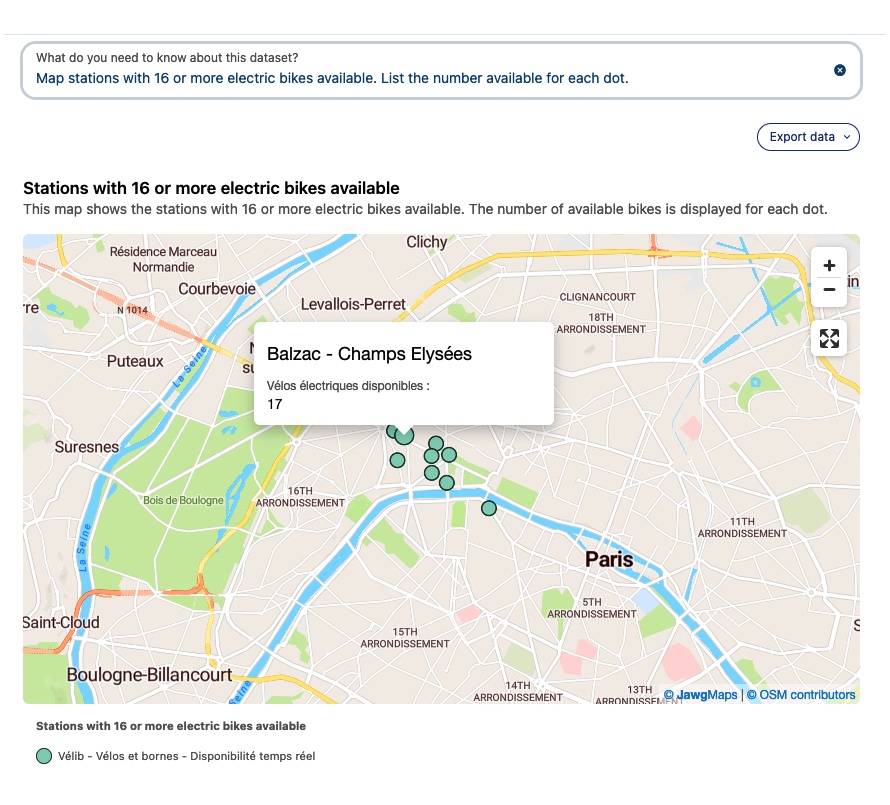
Note that maps can show only one kind of data point at a time. However, you can request that each data point include specific information from the dataset. For example, if you wanted to map the parking lots from the tip above, you can't ask that full parking lots be indicated in a different way. However, you can request that the number of remaining spots (assuming that column exists) can be included when you click on any given point in the map. An example of a column chart:An example of a map:
The bot can generally perform the following functions: count the total number of records, the number of distinct records, return a minimum or maximum value, do sums, or return an average or median value. Note that you can group or sort your results, and that it helps to specify the column it should use to do so.
 Getting started
 Exploring and using data
 Publishing data
 Managing your users
 Managing your portal